How to Build a Real Estate Proforma: Step-by-Step Guide
A proforma is the financial blueprint for every commercial real estate investment decision. It projects revenue, expenses, and returns over a hold period so you can answer one question: is this deal worth doing?
Whether you’re underwriting an acquisition, presenting to investors, or evaluating a refinance, the proforma is where assumptions become numbers. This guide walks through each section of a commercial real estate proforma, explains what goes where, and shows how the pieces connect.
What Is a Real Estate Proforma?
A proforma is a forward-looking financial model that projects a property’s income, expenses, and investment returns over a defined hold period (typically 5–10 years). It includes:
- Revenue projections — Rent rolls, vacancy, other income
- Expense projections — Operating costs with inflation
- Net Operating Income (NOI) — Revenue minus expenses
- Debt service — Mortgage payments on financed properties
- Cash flow — What the investor actually receives
- Return metrics — IRR, NPV, cash-on-cash, equity multiple
- Exit analysis — Reversion value at sale
The proforma is NOT a budget or historical statement. It’s a projection based on assumptions you control — and the quality of those assumptions determines the quality of the analysis.
Step 1: Build the Revenue Side
Start with the Rent Roll
The rent roll is the foundation. For each tenant, you need:
- Suite/unit number and area (SF)
- Current rent rate ($/SF or total monthly)
- Lease start and end dates
- Rent escalations (step increases, CPI adjustments)
- Renewal probability
- Recovery structure (NNN, modified gross, full service)
Example: 20,000 SF Office Building
| Suite | Tenant | Area (SF) | Rent ($/SF) | Lease End | Escalation |
|---|---|---|---|---|---|
| 101 | Acme Corp | 8,000 | $22.00 | Dec 2028 | 3% annual |
| 201 | Beta LLC | 5,000 | $20.00 | Jun 2027 | 3% annual |
| 301 | Vacant | 4,000 | — | — | — |
| 401 | Delta Inc | 3,000 | $24.00 | Mar 2030 | $0.50/yr |
Calculate Potential Gross Income
For leased suites, use contract rent. For vacant suites, use market rent from comparable properties:
| Source | Calculation | Annual |
|---|---|---|
| Suite 101 | 8,000 SF × $22.00 | $176,000 |
| Suite 201 | 5,000 SF × $20.00 | $100,000 |
| Suite 301 (market) | 4,000 SF × $19.00 | $76,000 |
| Suite 401 | 3,000 SF × $24.00 | $72,000 |
| PGI | $424,000 |
Apply Vacancy and Credit Loss
Even with signed leases, budget for vacancy between tenants and the occasional missed payment. A typical market vacancy factor is 5–10%:
Add Other Income
Include parking, storage, signage, antenna rent, late fees, and any other non-rent revenue:
| Item | Annual |
|---|---|
| Parking (10 spaces × $150/mo) | $18,000 |
| Storage rental | $3,600 |
| Total Other Income | $21,600 |
Effective Gross Income
Step 2: Model Operating Expenses
Categorize Every Expense
Group expenses by type and identify which are fixed (don’t change with occupancy) and which are variable (scale with how much space is occupied):
| Expense | Annual | Type | Recoverable? |
|---|---|---|---|
| Real estate taxes | $52,000 | Fixed | Yes (NNN) |
| Insurance | $12,000 | Fixed | Yes (NNN) |
| Utilities | $24,000 | Variable | Partial |
| Management (5% EGI) | $21,220 | Variable | Yes |
| R&M | $15,000 | Variable | Yes |
| Janitorial | $10,000 | Variable | Partial |
| Landscaping | $5,000 | Fixed | Yes |
| Administrative | $3,000 | Fixed | No |
| Total Operating Expenses | $142,220 |
Apply Inflation Over the Hold Period
Expenses don’t stay flat. Apply annual inflation rates — typically 2–4% depending on the category:
| Year | Taxes (3%) | Insurance (4%) | Utilities (3%) | Mgmt (3%) | Other (2.5%) |
|---|---|---|---|---|---|
| 1 | $52,000 | $12,000 | $24,000 | $21,220 | $33,000 |
| 2 | $53,560 | $12,480 | $24,720 | $21,857 | $33,825 |
| 3 | $55,167 | $12,979 | $25,462 | $22,512 | $34,671 |
This is where spreadsheets get tedious fast. Each expense line needs its own escalation rate, frequency, and start date — and they all compound independently.
Step 3: Calculate NOI
Year 1:
Project NOI for each year of the hold period, incorporating rent escalations on the revenue side and expense inflation on the cost side. NOI should generally grow over time in a healthy market.
Step 4: Add Debt Service
If the acquisition is financed (see our guide to CRE loan types for structure options), calculate annual mortgage payments:
| Loan Detail | Value |
|---|---|
| Purchase Price | $4,000,000 |
| LTV | 70% |
| Loan Amount | $2,800,000 |
| Interest Rate | 6.5% |
| Term | 30 years, amortizing |
| Annual Debt Service | $212,370 |
Debt Service Coverage Ratio (DSCR):
Above the typical 1.25× minimum — the loan works.
Step 5: Calculate Cash Flow
| Line Item | Year 1 |
|---|---|
| NOI | $282,180 |
| Less: Debt service | ($212,370) |
| Less: Capital reserves | ($8,000) |
| Less: Leasing costs | ($5,000) |
| Cash Flow Before Tax | $56,810 |
Cash-on-Cash Return:
Step 6: Model the Exit
At the end of your hold period, project a sale price using the terminal cap rate and the final year’s NOI:
If Year 7 NOI is $320,000 and you use a 7.5% terminal cap:
Subtract selling costs (typically 2–3%) and the remaining loan balance to get net sale proceeds.
Step 7: Calculate Return Metrics
With cash flows for each year plus the net sale proceeds at exit, you can calculate:
| Metric | Value | What It Tells You |
|---|---|---|
| IRR | 12.4% | Annualized return accounting for timing |
| NPV (at 8% discount) | $287,000 | Value created above your required return |
| Equity Multiple | 1.92× | Total return per dollar invested |
| Cash-on-Cash | 4.7% → 6.8% | Annual cash yield (grows with NOI) |
If IRR exceeds your hurdle rate and NPV is positive, the deal creates value. If not, either the price is too high or the assumptions need work.
The Problem with Spreadsheet Proformas
Building a proforma in Excel works — until it doesn’t:
- Lease rollovers: When Suite 201’s lease expires in Year 2, you need to model vacancy months, new market rent, TI costs, and leasing commissions — then recalculate everything downstream
- Step increases: Different tenants have different escalation schedules that compound independently
- Variable occupancy: Expenses like utilities and management fees change as occupancy changes
- Recovery calculations: NNN, base year stop, and modified gross recoveries each require different expense tracking
- Scenario analysis: Changing one assumption (cap rate, vacancy, rent growth) requires recalculating the entire model
One mislinked cell can cascade through years of projections without any visible error.
→ See the full Solsten vs Excel comparison to understand why purpose-built software eliminates these risks.
Automating the Proforma
Solsten builds the proforma automatically from your property inputs. Enter your rent roll, expenses, and financing — and get a complete operating statement with annual and monthly projections, return metrics, risk scoring, and exit scenario analysis.
The ML-powered forecasting engine handles:
- Rent escalations with step increases and market resets
- Expense inflation with per-category rates
- Tenant lifecycle projections (renewal probability, vacancy duration, market re-leasing)
- Variable occupancy impact on expenses and recoveries
- Debt service with amortization schedules
- Multi-scenario exit analysis with optimal year identification
No formulas to maintain, no cells to audit, no version control headaches.
Key Takeaways
- A proforma projects revenue, expenses, NOI, cash flow, and returns over a hold period
- Start with the rent roll — it drives everything else
- Separate fixed vs. variable expenses and apply category-specific inflation
- NOI should exclude debt service, capex, and income taxes
- Model the exit using a terminal cap rate on projected NOI
- IRR, NPV, equity multiple, and cash-on-cash together give the complete return picture
- Spreadsheets work for simple deals but break down as complexity grows
Related Articles
- How to Analyze a Rent Roll — The foundation of every proforma starts here
- How to Read & Analyze a T-12 Operating Statement — Master the historical financials behind your expense projections
- CRE Loan Types Explained — Understand the debt structures that drive Step 4
- What Is NOI in Commercial Real Estate? — The complete guide to net operating income
- Mastering IRR and NPV — Deep dive into the return metrics your proforma produces
- What Does a Good IRR Look Like? — Benchmarks by property type and risk profile
Explore Solsten
- CRE Proforma Software — Generate institutional-grade operating statements automatically
- Excel to Proforma — Import your existing spreadsheets into a live model
- DCF Analysis Software — IRR, NPV, and exit scenario optimization
- Plans & Pricing — Start your analysis for free
Try Solsten Free
See everything we discussed in action — no credit card required.
Start Your Free AnalysisRelated Articles
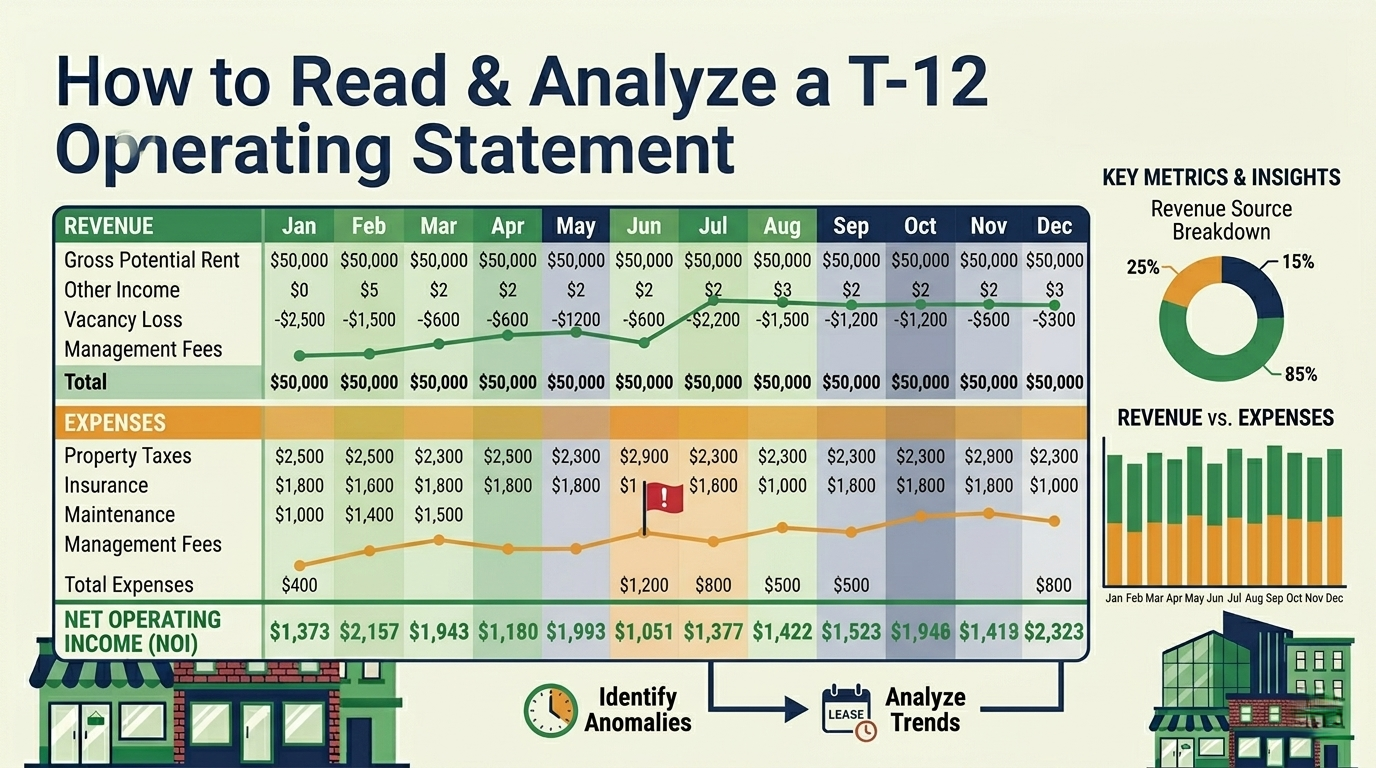
How to Read and Analyze a T-12 Operating Statement
Complete guide to reading a T-12 (trailing twelve months) operating statement for commercial real estate — line-by-line breakdown, red flags, normalization techniques, and how to turn a T-12 into proforma assumptions.
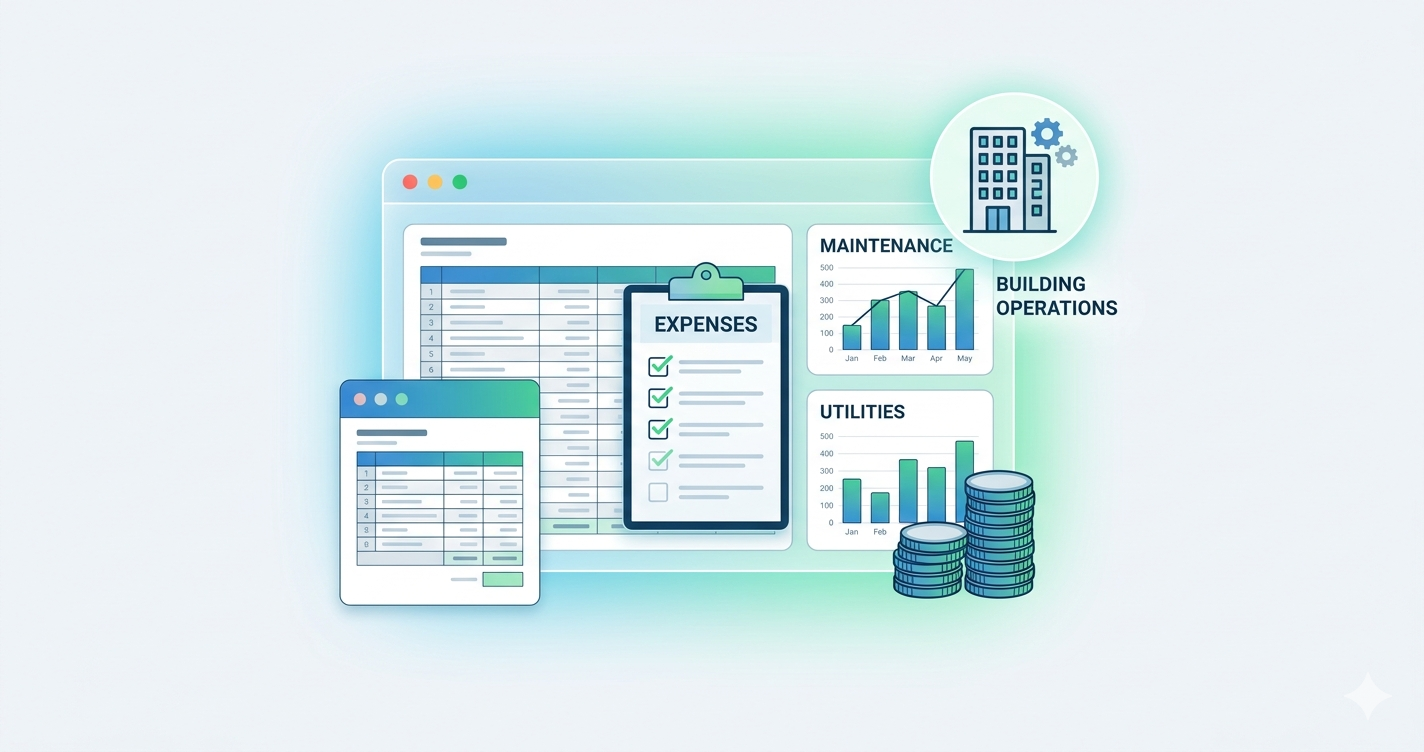
How to Calculate Operating Expenses for Commercial Real Estate
A complete guide to CRE operating expenses — categories, fixed vs. variable, below-the-line items, and how expense modeling affects your NOI, DSCR, and investment returns.
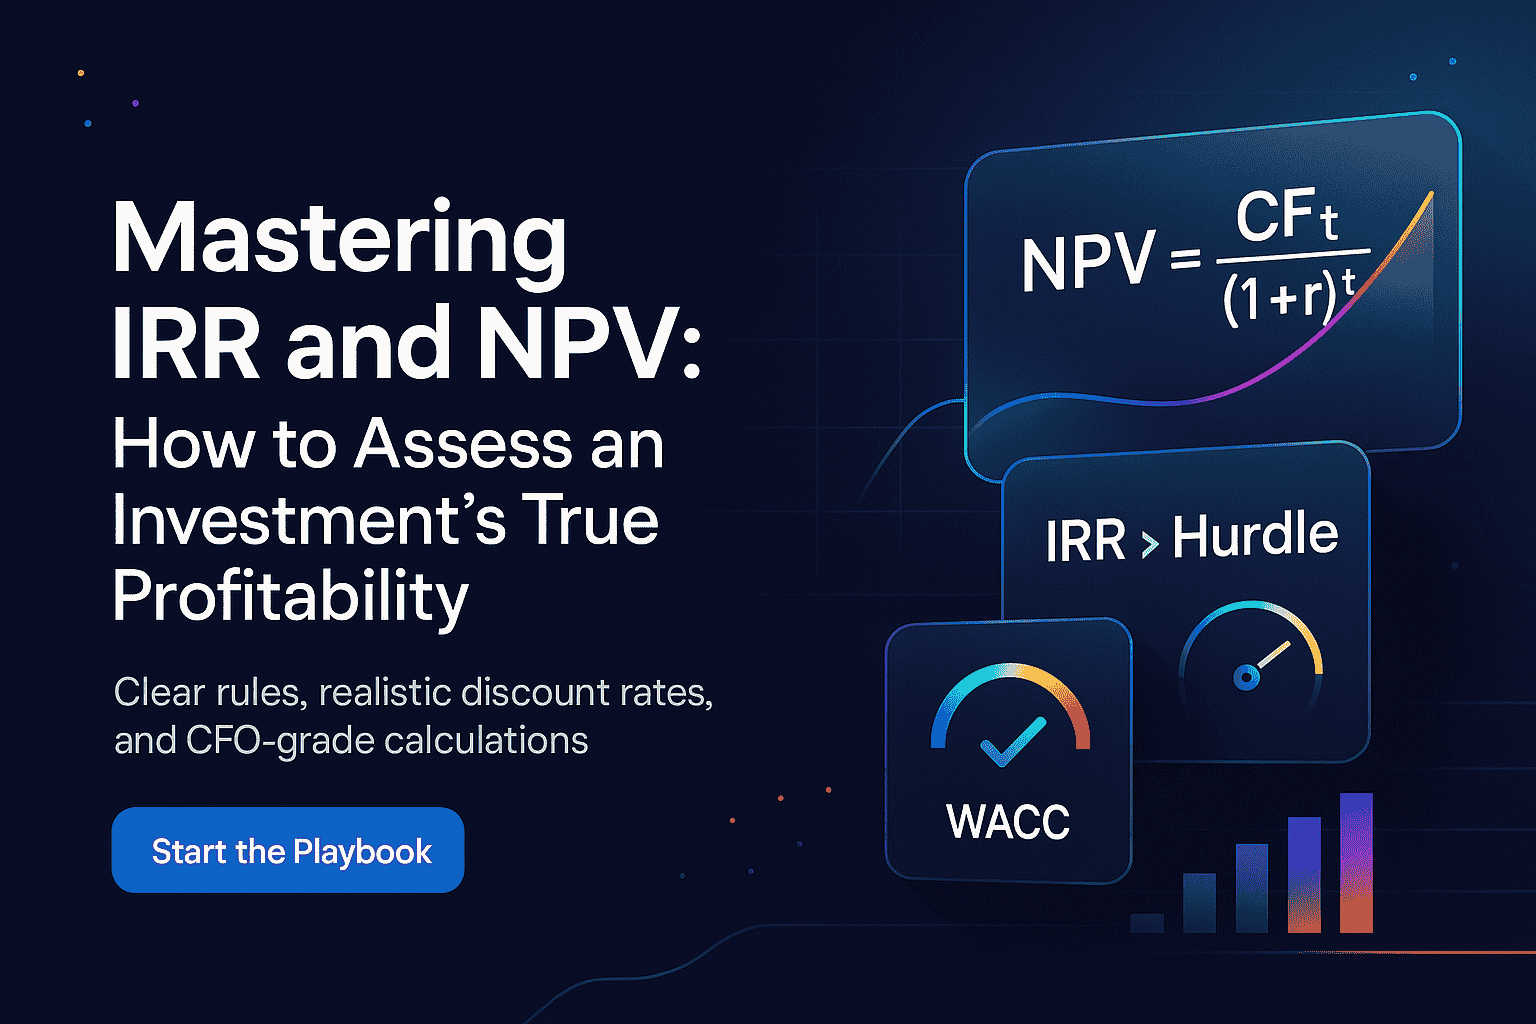
Mastering IRR and NPV: How to Assess an Investment's True Profitability
A complete guide to IRR and NPV for real estate investors — formulas, step-by-step examples, MIRR, WACC, sensitivity analysis, and when to trust which metric.