How to Read and Analyze a T-12 Operating Statement
Every serious CRE acquisition starts with a T-12. The offering memorandum has the story — the T-12 has the truth.
A T-12 (trailing twelve months) operating statement shows a property’s actual income and expenses over the most recent twelve-month period. It’s the foundation for your proforma projections, your NOI underwriting, and ultimately your purchase price.
But a T-12 is only useful if you know how to read it critically. Sellers present T-12s in their best light. Your job is to turn marketing into math.
What Is a T-12?
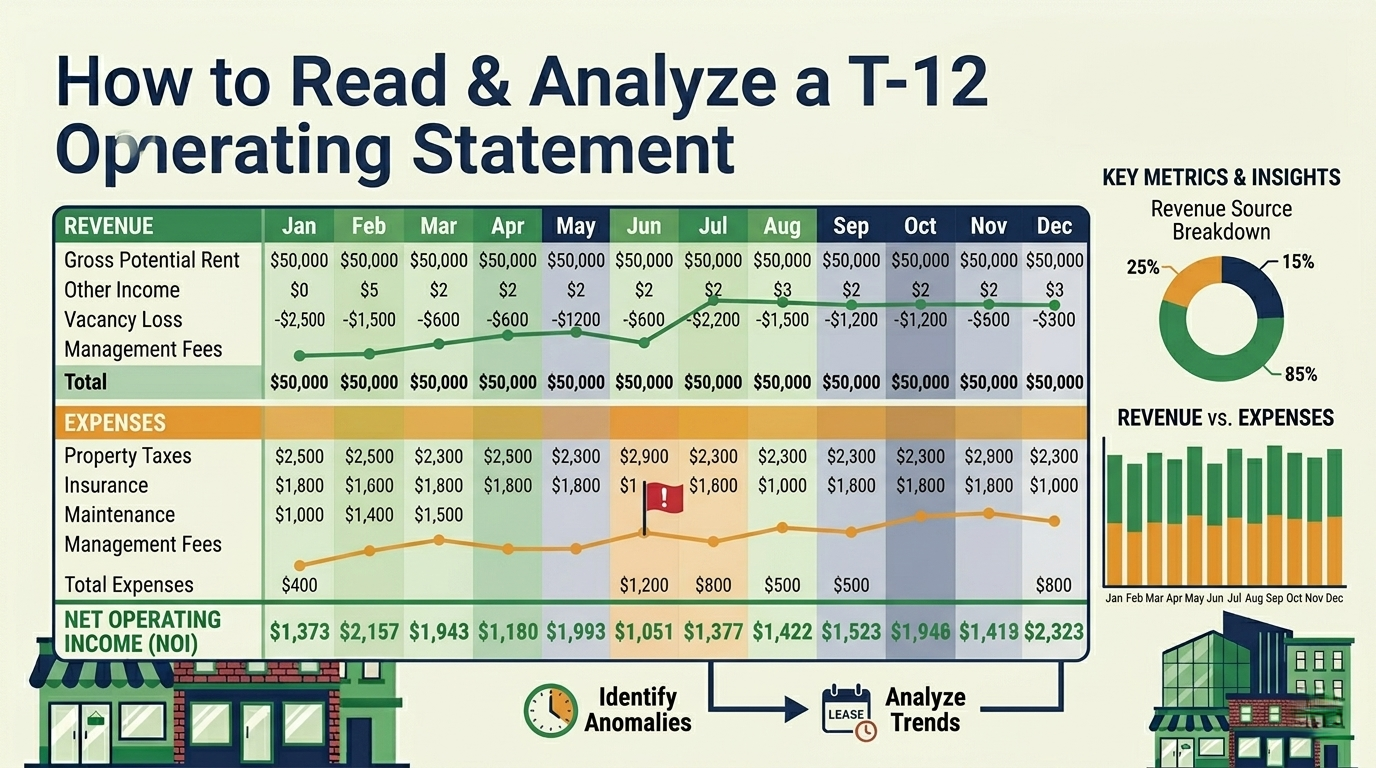
A T-12 is a month-by-month income and expense report covering the last 12 months of property operations. Unlike an annual financial statement, a T-12 shows you the timing and volatility of cash flows — not just the total.
Standard T-12 sections:
| Section | What It Contains |
|---|---|
| Gross Potential Rent (GPR) | Total rent if building were 100% occupied at contract rates |
| Vacancy & Credit Loss | Actual vacancy loss + uncollected rent |
| Effective Gross Income (EGI) | GPR minus vacancy, plus other income |
| Operating Expenses | Property taxes, insurance, utilities, repairs, management, etc. |
| Net Operating Income (NOI) | EGI minus operating expenses |
Each line item is broken out by month, giving you 12 data points per expense category.
Line-by-Line Analysis
Revenue Side
Gross Potential Rent (GPR): Cross-reference this against the rent roll. GPR should equal the sum of all tenants’ annual rent obligations. If GPR is higher than the rent roll supports, the seller may be inflating the number with “market rent” for vacant suites — that’s potential income, not actual income.
Vacancy loss: Compare the T-12’s vacancy deduction against the rent roll’s actual occupancy. If the T-12 shows 3% vacancy but the rent roll shows 88% occupancy, someone is using selective math.
Other income: Parking revenue, antenna/billboard leases, vending, late fees, storage rentals. These are often small individually but can add up to 5-10% of EGI. Verify which income streams are contractual (parking leases) vs. variable (vending commissions).
Reimbursement income (recoveries): CAM reimbursements, tax pass-throughs, and insurance pass-throughs from tenants. This should correlate with the lease recovery structures on the rent roll. If 80% of tenants are NNN and you see minimal recovery income, something doesn’t add up.
Expense Side
Property taxes: Usually the largest single expense. Verify against the county assessor’s records. Critical question: will the property be reassessed upon sale? In many jurisdictions, a change of ownership triggers reassessment to current market value, which can increase taxes 20-50%+ overnight.
Insurance: Should trend upward gradually. A sudden spike might indicate a major claim, location in a rising-risk zone, or a policy change. Get the actual declarations page — don’t rely on the T-12 alone.
Utilities: Look for seasonal patterns. HVAC-intensive properties (office, retail) should show summer and winter peaks. If utility costs are flat year-round, the building might have an all-electric system, tenant-metered utilities, or the numbers might be smoothed.
Repairs and maintenance (R&M): The most commonly manipulated line item. Sellers defer maintenance before selling to make NOI look better. Compare R&M to building age and size:
| Building Age | Typical R&M Range (per SF) |
|---|---|
| Under 10 years | $0.50 – $1.50 |
| 10-25 years | $1.50 – $3.00 |
| 25+ years | $3.00 – $5.00+ |
If a 30-year-old office building shows $0.75/SF in R&M, the seller is either neglecting the building or capitalizing expenses that should be operating.
Management fees: Typically 3-6% of EGI for third-party management. If the property is self-managed, the T-12 may show zero — but you should add a market-rate management fee to your proforma because you’ll likely need one.
Capital expenditures (CapEx): CapEx is typically shown below the NOI line and is NOT an operating expense. However, sellers sometimes reclassify recurring maintenance as CapEx to reduce operating expenses and inflate NOI. A new roof is CapEx. An annual HVAC tune-up is an operating expense. Know the difference.
Normalizing the T-12
A raw T-12 tells you what happened. A normalized T-12 tells you what should happen under your ownership. Normalization adjusts for seller-specific items, one-time events, and management inefficiencies.
Common Normalizations
1. Add back self-management: If the seller manages the property themselves and shows no management fee, add 4-5% of EGI as a management expense.
2. Adjust property taxes for reassessment:
If you’re paying $5M for a property assessed at $3M, your taxes are going up. This is often the single largest normalization adjustment.
3. Normalize R&M for deferred maintenance: If R&M looks unreasonably low, adjust upward to a market-comparable level. Don’t assume the seller’s deferred maintenance is your savings — it’s your deferred liability.
4. Remove one-time items: Legal settlements, insurance claims, extraordinary repairs, or seller-specific administrative costs should be stripped out.
5. Adjust vacancy to stabilized rate: If the property was 100% occupied all 12 months but the market natural vacancy is 8%, use 8% in your proforma. Conversely, if the T-12 captures a major tenant move-out, your forward vacancy might be lower than the trailing period shows.
6. Mark insurance to current quotes: Insurance markets shift. Get a current quote for the property rather than relying on the seller’s existing policy premium.
Normalization Example
| Line Item | T-12 Actual | Adjustment | Normalized |
|---|---|---|---|
| EGI | $450,000 | — | $450,000 |
| Property Tax | $45,000 | +$15,000 (reassessment) | $60,000 |
| Insurance | $18,000 | +$4,000 (current quote) | $22,000 |
| Utilities | $32,000 | — | $32,000 |
| R&M | $8,000 | +$12,000 (deferred adj.) | $20,000 |
| Management | $0 | +$22,500 (5% of EGI) | $22,500 |
| Other OpEx | $15,000 | -$5,000 (one-time legal) | $10,000 |
| Total OpEx | $118,000 | $166,500 | |
| NOI | $332,000 | $283,500 |
The seller’s T-12 shows a 6.64% cap rate at a $5M price. After normalization, the actual cap rate is 5.67%. That’s a meaningful difference — and it’s entirely hidden in the raw T-12.
Month-by-Month vs. Annual Analysis
The power of a T-12 over an annual statement is the monthly granularity. Use it.
Trend identification: Is NOI improving or declining month-over-month? Are expenses creeping up faster than rents?
Seasonality: Properties in extreme climates show 30-50% swings in utility costs between peak and off-peak months. Your proforma needs to account for this, especially for monthly cash flow projections and DSCR testing.
Timing anomalies: Tax payments are typically quarterly or semi-annual. Insurance may be one annual lump sum. If you annualize a month that includes a quarterly tax payment, you’ll overstate tax expense by 4x. Look at the full 12 months for the correct annual total.
Occupancy events: A major tenant move-in or move-out will show as a step change in rental income. Identify which months were affected so you can separate the property’s run-rate performance from transition noise.
T-12 Red Flags
1. Round numbers everywhere. Real expenses don’t come in at exactly $5,000 per month for 12 straight months. Rounded numbers suggest estimates, not actuals.
2. Expenses declining into the sale. If R&M drops 40% in the last 6 months, the seller is likely deferring work to boost NOI for the sale.
3. Missing months. A T-12 that only shows 9 months of data isn’t a T-12. Request the complete period.
4. Management fee above 8%. Either the property is very small (higher per-unit costs) or fees include items that should be separate line items.
5. No recovery income on NNN leases. If tenants are on NNN structures per the rent roll, the T-12 should show corresponding reimbursement income.
6. CapEx classified as OpEx. Roof replacements, parking lot repaving, and major HVAC replacements are capital — not operating expenses. If they’re in the T-12 operating section, NOI is understated and the seller might be positioning for a higher residual value.
These red flags should trigger deeper investigation. Our due diligence checklist covers the full scope of physical, legal, and market verification alongside the T-12 review.
From T-12 to Proforma
Your normalized T-12 becomes Year 1 of your proforma. Each line item gets an inflation assumption, which projects it forward through your hold period:
The key decisions at this stage:
-
Which inflation rate for each expense? Property taxes often grow faster than general CPI. Insurance has its own cycle. Utilities depend on local rate trends.
-
Which expenses are fixed vs. variable? Variable expenses (utilities, R&M, management fees) fluctuate with occupancy. Fixed expenses (taxes, insurance) don’t care if the building is empty.
-
How do recovery structures offset expense growth? In NNN properties, rising expenses are mostly offset by rising recoveries. In gross leases, the landlord absorbs all increases.
Getting this translation right — from historical T-12 data to forward-looking proforma assumptions — is the core skill of CRE underwriting. It’s where most deals are won or lost. For properties with significant upside, see our guide on underwriting value-add deals.
Key Takeaways
-
Cross-reference the T-12 against the rent roll. Income should match. If it doesn’t, find out why.
-
Normalize for your ownership, not the seller’s. Add management fees, adjust taxes for reassessment, fix deferred R&M.
-
Low R&M on old buildings is a cost you haven’t paid yet — not a savings. Deferred maintenance always catches up.
-
Use monthly granularity. Seasonal patterns, occupancy events, and timing anomalies are invisible in annual summaries.
-
The gap between T-12 NOI and normalized NOI IS the deal. That spread determines whether the property is over-priced, fairly priced, or an opportunity.
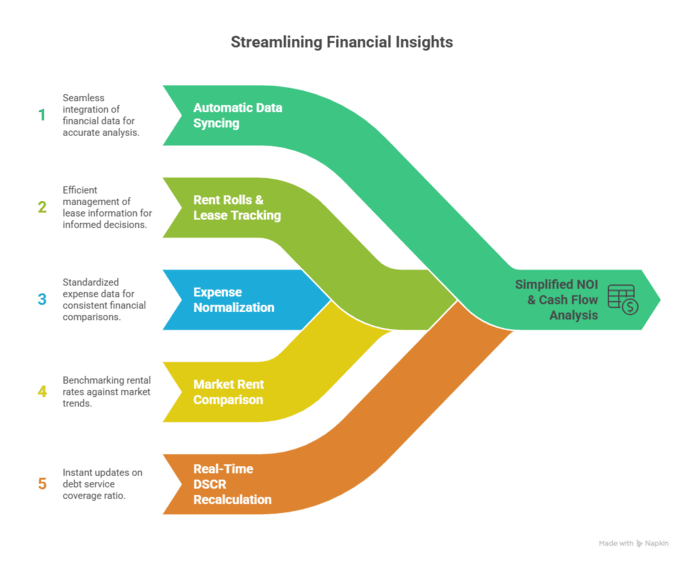
Eric Davis is the founder of Nordic Real Estate Services and creator of Solsten, a CRE analysis platform that imports T-12 spreadsheets directly via a 4-step Excel import wizard with ML-powered expense forecasting. See how Excel import works →
Try Solsten Free
See everything we discussed in action — no credit card required.
Start Your Free AnalysisRelated Articles
How to Calculate Operating Expenses for Commercial Real Estate
A complete guide to CRE operating expenses — categories, fixed vs. variable, below-the-line items, and how expense modeling affects your NOI, DSCR, and investment returns.
How to Build a Real Estate Proforma: Step-by-Step Guide
Learn how to build a commercial real estate proforma from scratch — revenue projections, expense modeling, NOI, debt service, cash flow, and return metrics explained with examples.
What Is NOI in Commercial Real Estate? The Complete Guide
Net Operating Income (NOI) explained — formula, calculation examples, what to include and exclude, and how NOI drives cap rates, debt sizing, and property valuation.