How to Analyze a Rent Roll: The CRE Underwriter's Complete Guide
The rent roll is the first document any acquisitions analyst opens when evaluating a commercial property. Before you touch a proforma, before you model debt, before you calculate returns — you read the rent roll.
A rent roll tells you who pays the bills. It tells you when those payments might stop. And if you know what to look for, it tells you exactly where the deal’s risk is hiding.
This guide covers how to read a rent roll, what metrics to calculate from it, where most analysts make mistakes, and how rent roll analysis drives every downstream underwriting decision.
What Is a Rent Roll?
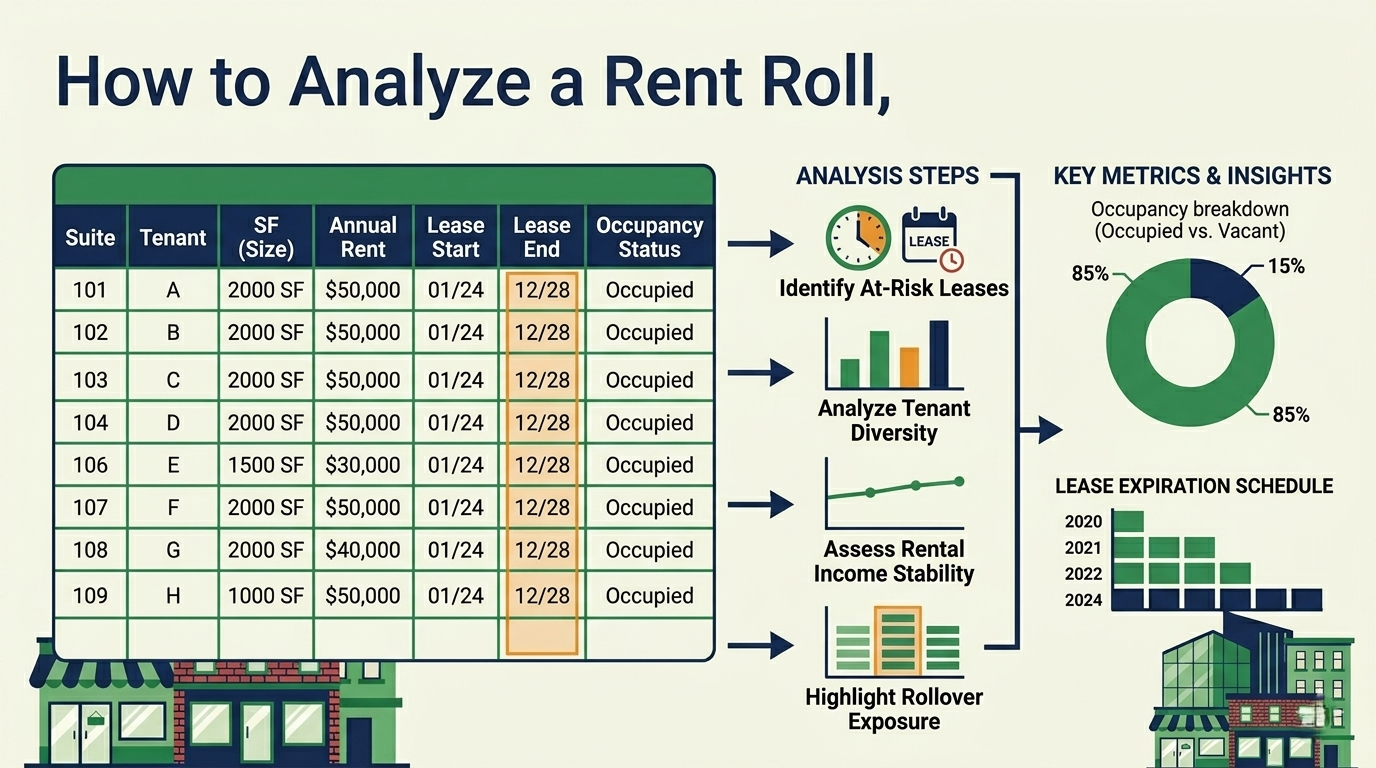
A rent roll is a schedule of all tenants in a commercial property, listing their lease terms, rental rates, occupied square footage, and lease expiration dates. Think of it as a snapshot of the property’s income stream at a specific point in time.
A typical rent roll includes:
| Field | What It Tells You |
|---|---|
| Tenant Name | Who occupies the space |
| Suite Number | Where they are in the building |
| Rentable SF | How much space they lease |
| Base Rent ($/SF) | Their contracted rental rate |
| Annual Rent ($) | Total annual rent obligation |
| Lease Start Date | When the lease began |
| Lease Expiration | When the lease ends |
| Recovery Type | NNN, Base Year Stop, Modified Gross |
| Options | Renewal options, expansion rights, termination rights |
| Rent Escalations | Built-in step increases or CPI adjustments |
Some rent rolls also include security deposits, free rent periods, tenant improvement allowances, and leasing commission obligations.
Step-by-Step Rent Roll Analysis
Step 1: Calculate Occupancy
The first number every investor asks about. Calculate it two ways:
Physical Occupancy:
Economic Occupancy (accounts for free rent, abatements, and delinquencies):
A property can be 95% physically occupied but only 85% economically occupied if several tenants are in free rent periods or behind on payments.
Why economic occupancy matters more: Physical occupancy looks great in marketing materials, but economic occupancy determines your actual cash flow. Always calculate both.
Step 2: Analyze Lease Expiration Schedule
Plot every lease expiration by year and by square footage. This tells you your rollover risk — how much income is at risk in any given year.
Example lease expiration schedule:
| Year | SF Expiring | % of Building | Cumulative % |
|---|---|---|---|
| 2026 | 5,000 | 10% | 10% |
| 2027 | 12,000 | 24% | 34% |
| 2028 | 3,000 | 6% | 40% |
| 2029 | 15,000 | 30% | 70% |
| 2030 | 8,000 | 16% | 86% |
In this example, 34% of the building rolls by 2027 — a major concentration risk. If market conditions soften, you could face significant re-leasing exposure in a short window.
Red flags:
- More than 25% of SF expiring in a single year
- Multiple large tenants expiring in the same 12-month window
- Lease expirations clustered in the first 2-3 years of your hold period
Step 3: Evaluate Weighted Average Lease Term (WALT)
WALT tells you the average remaining lease duration, weighted by each tenant’s contribution to income:
Example:
| Tenant | Annual Rent | Remaining Term | Weighted |
|---|---|---|---|
| A | $120,000 | 6 years | $720,000 |
| B | $80,000 | 2 years | $160,000 |
| C | $50,000 | 8 years | $400,000 |
| Total | $250,000 | $1,280,000 |
Benchmarks:
- 7+ years WALT: Strong — long-dated income, lower rollover risk
- 4-7 years: Moderate — manageable with diversified expirations
- Under 4 years: Elevated risk — significant near-term income uncertainty
Step 4: Check Rental Rates vs. Market
Compare each tenant’s in-place rent to current market rates. This tells you whether rents are above market (rolldown risk) or below market (mark-to-market upside).
If the gap is positive, you have upside — when leases roll, you can likely increase rents. This mark-to-market gap is the core thesis behind value-add underwriting. If the gap is negative, tenants may leave or negotiate lower rents at renewal.
Important: Below-market rents are only an opportunity if the lease actually expires during your hold period. A tenant paying $18/SF on an in-place lease with 12 years remaining in a $25/SF market sounds great — but you won’t capture that upside for over a decade.
Step 5: Analyze Tenant Concentration
How dependent is the property on any single tenant?
Risk thresholds:
- Under 15%: Diversified — loss of one tenant is manageable
- 15-30%: Moderate concentration — underwrite the credit carefully
- 30%+: High concentration — the deal lives or dies on this tenant
- 50%+: Single-tenant risk — essentially a credit play on one company
For high-concentration tenants, dig into their financial health (public filings, credit ratings), industry outlook, and whether the space is mission-critical to their operations.
Step 6: Review Rent Escalations
Most commercial leases include built-in rent increases. Common structures:
- Fixed step increases: Rent increases by a set $/SF or % on each anniversary
- CPI-based: Rent adjusts annually based on Consumer Price Index
- Percentage of sales: Common in retail — base rent plus a percentage of gross sales above a threshold
Step increases are critical for projection accuracy. A tenant at $15/SF today with 3% annual bumps will be at $17.39/SF in five years:
If your proforma doesn’t account for contractual step increases, you’re leaving real income off the table.
Step 7: Identify Lease-Up and Vacancy Costs
For every vacant suite, estimate:
- Months to lease: How long will it take to find a tenant? Market average is typically 6-12 months for office, 3-6 for industrial.
- Tenant improvement (TI) costs: What will you spend to build out the space? Ranges from $5/SF (industrial) to $60+/SF (office).
- Leasing commissions (LC): Typically 4-6% of total lease value.
- Free rent: New tenants often negotiate 1-3 months of free rent.
These vacancy costs directly reduce your returns. A suite that rents for $25/SF but requires $40/SF in TI and 3 months free rent needs over 2 years just to break even on the lease-up investment.
Red Flags in Rent Roll Analysis
1. Stale rent roll dates. If the rent roll is dated 6+ months ago, ask for an update. Tenants could have vacated, defaulted, or exercised options since then.
2. Holdover tenants. Tenants operating month-to-month after lease expiration are a flight risk. They can leave with 30 days notice. Treat their income as uncertain.
3. Related-party tenants. If the seller’s company occupies 30% of the building, that tenant may leave after the sale. Underwrite the deal as if they’ll vacate.
4. Concession-heavy leases. Large TI allowances, extended free rent, and above-market commissions suggest the owner is struggling to attract or retain tenants.
5. Below-market credit tenants. A full building means nothing if the tenants can’t pay. Check for late payments, workout agreements, or tenants in declining industries.
6. Missing escalations. Flat leases in an inflationary environment mean your real income declines every year. Over a 10-year hold, 3% annual inflation erodes 26% of your purchasing power on a flat-rate lease.
For a comprehensive list of items to verify beyond the rent roll — including physical, legal, and market checks — see our CRE due diligence checklist.
From Rent Roll to Proforma
A rent roll is a snapshot. A proforma is a movie. The rent roll gives you today’s income; the T-12 operating statement gives you today’s expenses. Together, they project forward by answering:
- What happens at each lease expiration? (Renewal vs. vacancy)
- How long does vacancy last?
- At what rate does the new tenant sign?
- What are the re-leasing costs (TI, LC, free rent)?
- How do contractual escalations grow in-place rents?
- What’s the recovery income from each tenant?
Every assumption in your proforma should trace back to something you discovered in the rent roll analysis. If you can’t justify an assumption from the rent roll or market data, it’s a guess — and guesses compound dangerously over a 7-10 year hold period.
Key Takeaways
-
Start with economic occupancy, not physical. Revenue depends on collected rent, not just filled space.
-
WALT and lease expiration schedule are your risk map. Short WALT plus clustered expirations equals high cash flow volatility.
-
Compare in-place rents to market rents for every tenant. This drives your mark-to-market upside (or rolldown risk) at lease expiration.
-
Tenant concentration above 30% is a credit bet. Underwrite that tenant’s business as carefully as you underwrite the property.
-
Vacancy costs are often underestimated. TI, LC, free rent, and downtime can eat 2+ years of rental income for each suite turnover.
-
Every proforma assumption should trace back to the rent roll. If it doesn’t, you’re guessing.
Eric Davis is the founder of Nordic Real Estate Services and creator of Solsten, a CRE analysis platform with automated rent roll timelines, tenant lifecycle projections, and ML-powered occupancy forecasting. Explore rent roll features →
Try Solsten Free
See everything we discussed in action — no credit card required.
Start Your Free AnalysisRelated Articles
What Is Effective Gross Income (EGI) in Commercial Real Estate?
Understand Effective Gross Income (EGI) in CRE — how it's calculated, why it matters more than PGI, and how vacancy, credit loss, and other income affect your underwriting.

What Is Cash-On-Cash Return? Formula, Example, and Benchmark
Cash-on-cash return is annual pre-tax cash flow divided by total cash invested. This guide walks through the formula, a step-by-step CRE example, and what counts as a good benchmark.
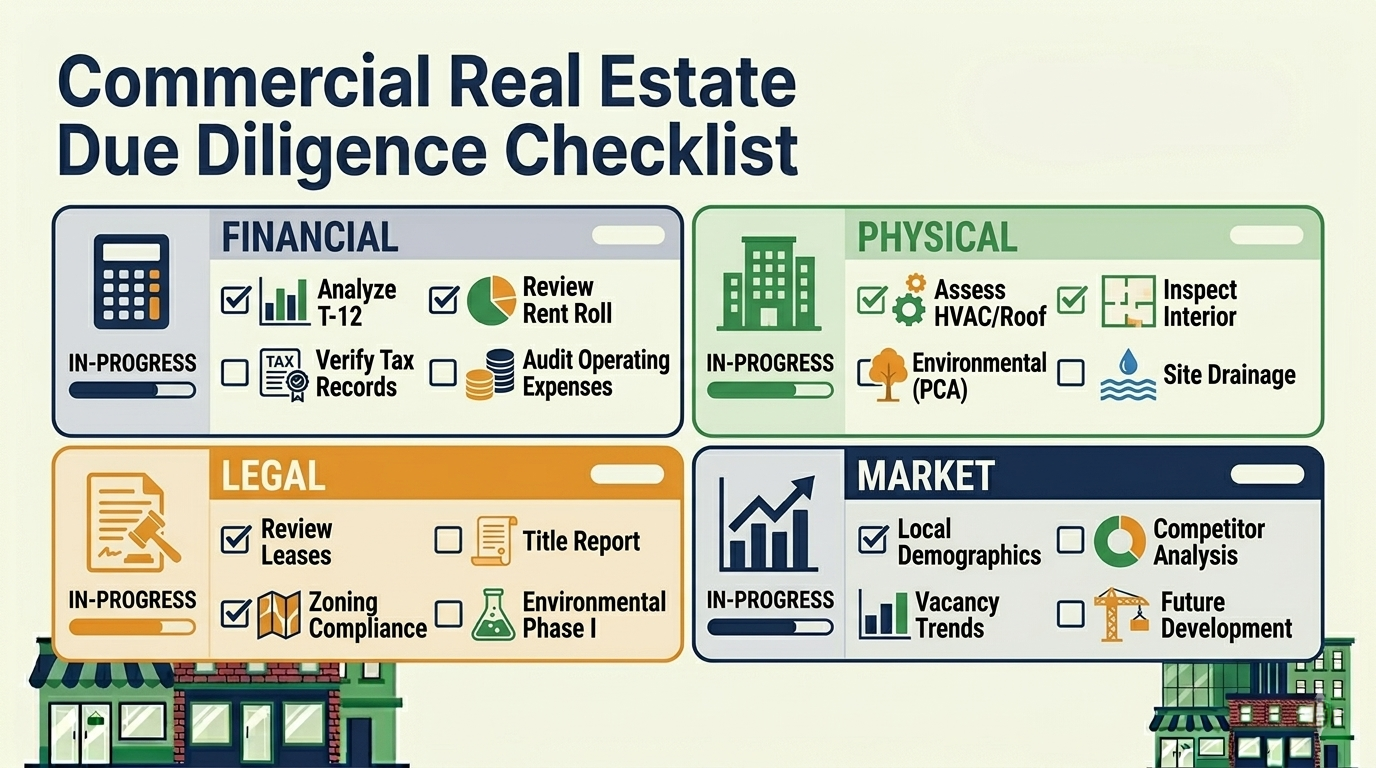
Commercial Real Estate Due Diligence Checklist: What to Verify Before Closing
Complete CRE due diligence checklist covering financial, physical, legal, environmental, and market verification — what to request, what to analyze, and what kills deals.