What Is Effective Gross Income (EGI) in Commercial Real Estate?
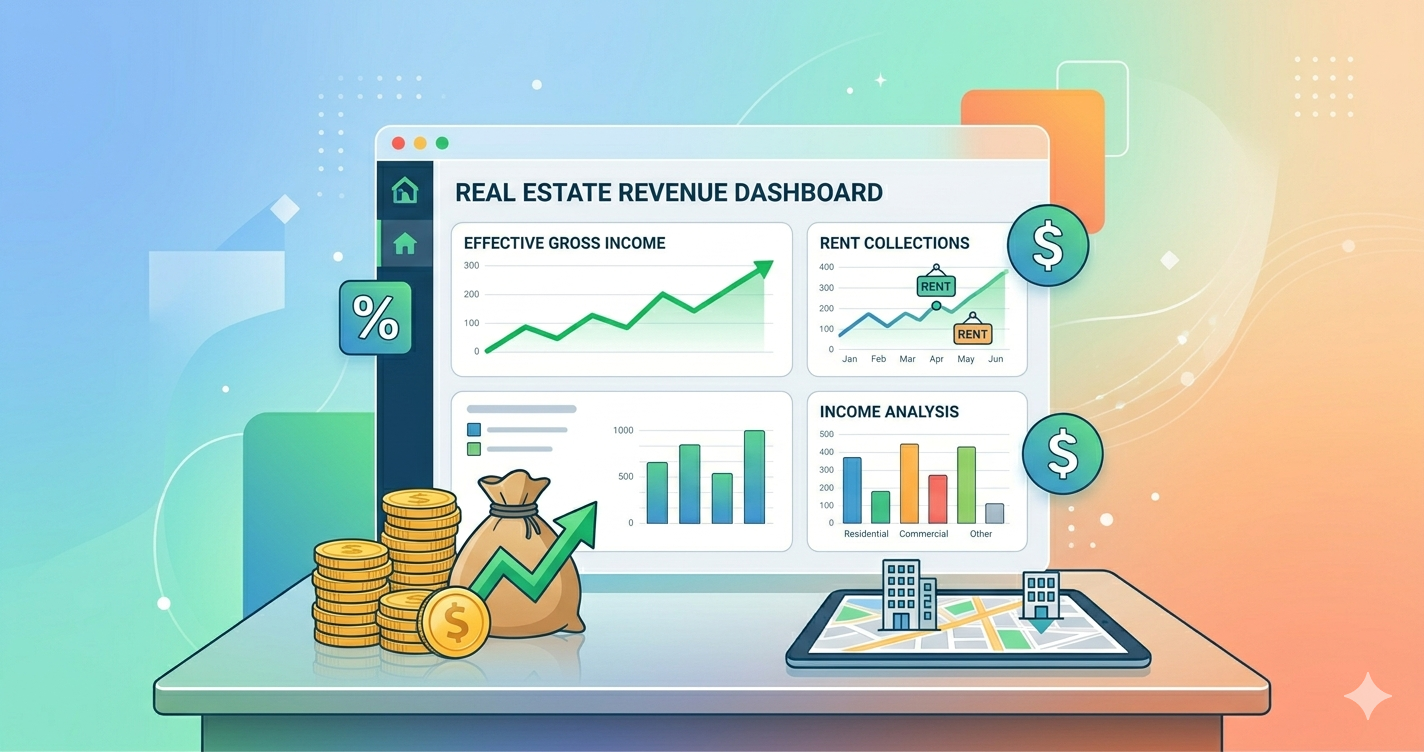
If you’re underwriting commercial real estate and only looking at the rent roll total, you’re looking at the wrong number. The rent roll gives you Potential Gross Income (PGI) — the theoretical maximum if every suite were leased and every tenant paid on time. That never happens.
Effective Gross Income (EGI) is what you’ll actually collect. It’s the starting point for every meaningful metric in CRE — NOI, cap rate, DSCR, cash-on-cash, and IRR all flow from EGI.
The Operating Statement Flow
Before diving into EGI specifically, here’s where it sits in the operating statement:
Potential Gross Income (PGI)
  − Vacancy Loss
  − Credit Loss
  + Other Income
= Effective Gross Income (EGI)
  − Operating Expenses
= Net Operating Income (NOI)
  − Debt Service
  − Capital Expenditures
= Cash Flow Before Tax
EGI is the bridge between theoretical revenue and actual revenue. Everything below it — expenses, debt service, returns — depends on getting this number right.
How to Calculate EGI
Step 1: Calculate Potential Gross Income (PGI)
PGI is the total rental income the property would generate at 100% occupancy with all tenants paying full contract rent. It includes:
- Contract rent from all existing leases (by suite, at current escalated rates)
- Market rent for any vacant suites (what you’d charge if leased today)
Example:
Suite 101: 5,000 SF × $22/SF = $110,000
Suite 102: 3,000 SF × $24/SF = $72,000
Suite 103: 4,000 SF × $20/SF = $80,000 (vacant — at market rate)
Suite 104: 2,500 SF × $23/SF = $57,500

PGI = $319,500
Note that Suite 103 is vacant but still included in PGI at market rent. PGI represents the theoretical ceiling.
Step 2: Subtract Vacancy Loss
Vacancy loss accounts for the income you won’t collect because suites are or will be unoccupied. There are several components:
Physical vacancy: Suites that are currently empty. In your proforma, this is driven by your occupancy assumptions — when leases expire, how long suites stay vacant before re-leasing, and renewal probability.
Absorption vacancy: Time between a lease being signed and the tenant actually moving in. Even after signing, there may be a buildout period.
Structural vacancy: Some properties always have some vacancy due to market conditions. A 5% structural vacancy assumption is common in stable markets.
Example:
PGI: $319,500
Vacancy assumption: 8% ($25,560)
PGI − Vacancy = $293,940
Step 3: Subtract Credit Loss
Credit loss (sometimes called “collection loss” or “bad debt”) accounts for tenants who are in occupancy but don’t pay. This happens more than people think:
- Tenants in financial distress who stop paying rent
- Lease disputes leading to withheld rent
- Bankruptcies where you’re last in line as an unsecured creditor
Typical assumption: 1-3% of PGI for well-tenanted properties, higher for properties with lower credit-quality tenants.
Example:
Credit loss: 2% of PGI ($6,390)
After vacancy and credit: $293,940 − $6,390 = $287,550
Step 4: Add Other Income
Other income is revenue that doesn’t come from base rent. Common sources:
- Parking income — structured or surface parking, monthly passes
- Storage rental — basement or unit storage
- Vending and laundry — machine income in multifamily or industrial
- Antenna/billboard leases — rooftop cell tower or signage rights
- Late fees — penalty income from late-paying tenants
- Percentage rent — retail leases where landlord gets a % of tenant sales above a breakpoint
- Recovery income — NNN, Base Year Stop, or Modified Gross pass-throughs
Example:
Parking: $18,000/year
Storage: $6,000/year
Recovery income: $42,000/year
Other income total: $66,000
Final EGI
PGI:              $319,500
− Vacancy:        ($25,560)
− Credit Loss:    ($6,390)
+ Other Income:   $66,000
= EGI:            $353,550
Why EGI Matters More Than PGI
For Valuation
Cap rate applies to NOI, and NOI starts from EGI, not PGI. If you value a property using PGI-derived NOI, you’re overpaying.
For Debt Sizing
Lenders underwrite off NOI to calculate DSCR. If your EGI is inflated (because you understated vacancy or ignored credit loss), your NOI is too high, your DSCR looks better than reality, and you risk overleveraging.
For Investor Returns
IRR and cash-on-cash return projections flow from actual cash received — which is EGI minus expenses, not PGI minus expenses. Overstating EGI by even 5% can swing an IRR projection by 100-200 basis points.
For Operating Expense Recovery
Recovery calculations (NNN, Base Year Stop) are often based on occupied area, not total area. Your recovery income — which feeds into EGI — depends on getting occupancy right.
Common EGI Mistakes
1. Using Market Rent for Occupied Suites
PGI for occupied suites should use contract rent (what the lease says), not market rent. A tenant paying $18/SF on a lease signed three years ago is contributing $18/SF to your PGI, even if market rent is now $22/SF.
Market rent applies to:
- Vacant suites (what you’d lease them for)
- Projected renewals (at market or a premium/discount)
- New tenant projections
2. Ignoring the Timing of Vacancy
Vacancy isn’t an annual percentage — it happens at specific times when leases expire. A lease expiring in month 3 with 4 months of projected vacancy means you collect 3 months of rent from the outgoing tenant and (potentially) 5 months from the incoming tenant — but 4 months of nothing.
Institutional underwriting models vacancy on a monthly basis, not as an annual percentage haircut. The annual method can significantly overstate or understate EGI depending on when expirations cluster.
3. Double-Counting Recovery Income
If recovery income is already embedded in the rent (Modified Gross structure where taxes and insurance are included in base rent), don’t add it again as “other income.” That’s double-counting.
4. Projecting Credit Loss at 0%
Even Class A properties with investment-grade tenants occasionally have collection issues. A 0.5-1% credit loss assumption is standard for high-quality properties. For value-add or lower-credit tenant bases, 2-3% is more appropriate.
5. Static Vacancy Assumptions
A flat 5% vacancy across a 10-year proforma ignores the reality that vacancy clusters around lease expirations. Year 3 might have 15% vacancy (three leases expiring) while Year 7 might have 2%. Month-by-month modeling captures this; flat percentages miss it entirely.
EGI in Multi-Year Projections
In a proforma, EGI changes year to year because:
- Rents escalate — step increases, CPI adjustments, renewal rates
- Leases expire and renew — new rates, potential vacancy gaps
- Other income grows — parking rates increase, new recovery income from escalating expenses
- Market conditions change — vacancy rates shift, credit quality evolves
A proper 10-year proforma projects EGI annually (or monthly) by modeling each of these components individually, not by applying a flat growth rate to year 1 EGI.
EGI by Property Type
Different asset classes have different EGI profiles:
Office
- Higher vacancy rates (10-15% typical)
- Significant recovery income (NNN or Base Year Stop)
- Longer vacancy periods between tenants (6-12 months)
- TI and leasing commission costs are high but below the line
Retail
- Percentage rent adds variability to other income
- Anchor vs. inline tenant mix affects vacancy risk
- CAM recovery structures can be complex
- Lower vacancy for well-located properties (5-8%)
Industrial
- NNN structures are standard — predictable EGI
- Low vacancy in strong markets (3-5%)
- Minimal TI costs
- Other income from outside storage, truck court fees
Multifamily
- Many small tenants — higher credit loss risk but diversified
- Monthly lease turns — vacancy is rolling, not clustered
- Other income from parking, laundry, pet fees, utilities
- No recovery structures — gross rent includes everything
How This Connects to NOI and Returns
EGI is the top of the funnel for every return metric:
EGI × (1 − OpEx Ratio) ≈ NOI
NOI ÷ Purchase Price = Cap Rate
NOI ÷ Debt Service = DSCR
(NOI − Debt Service) ÷ Equity = Cash-on-Cash
DCF of all cash flows → IRR
A 5% error in EGI cascades through every calculation. If you overstate EGI by $50K on a property valued at a 6% cap:
- NOI is overstated by ~$50K (assuming expenses are independent)
- Property value is overstated by ~$833K ($50K ÷ 0.06)
- DSCR is overstated, potentially masking a coverage issue
Key Takeaways
- EGI = PGI − Vacancy − Credit Loss + Other Income — memorize this
- Contract rent for occupied suites, market rent for vacant — don’t mix them
- Model vacancy monthly, not annually — flat percentages miss clustering
- Always include credit loss — 0.5-1% minimum for Class A, 2-3% for value-add
- Don’t double-count recovery income — understand your lease structures
- EGI drives everything — NOI, cap rate, DSCR, IRR all depend on getting this right
- Project EGI year by year — flat growth rates hide the reality of lease rollovers
Try Solsten Free
See everything we discussed in action — no credit card required.
Start Your Free AnalysisRelated Articles
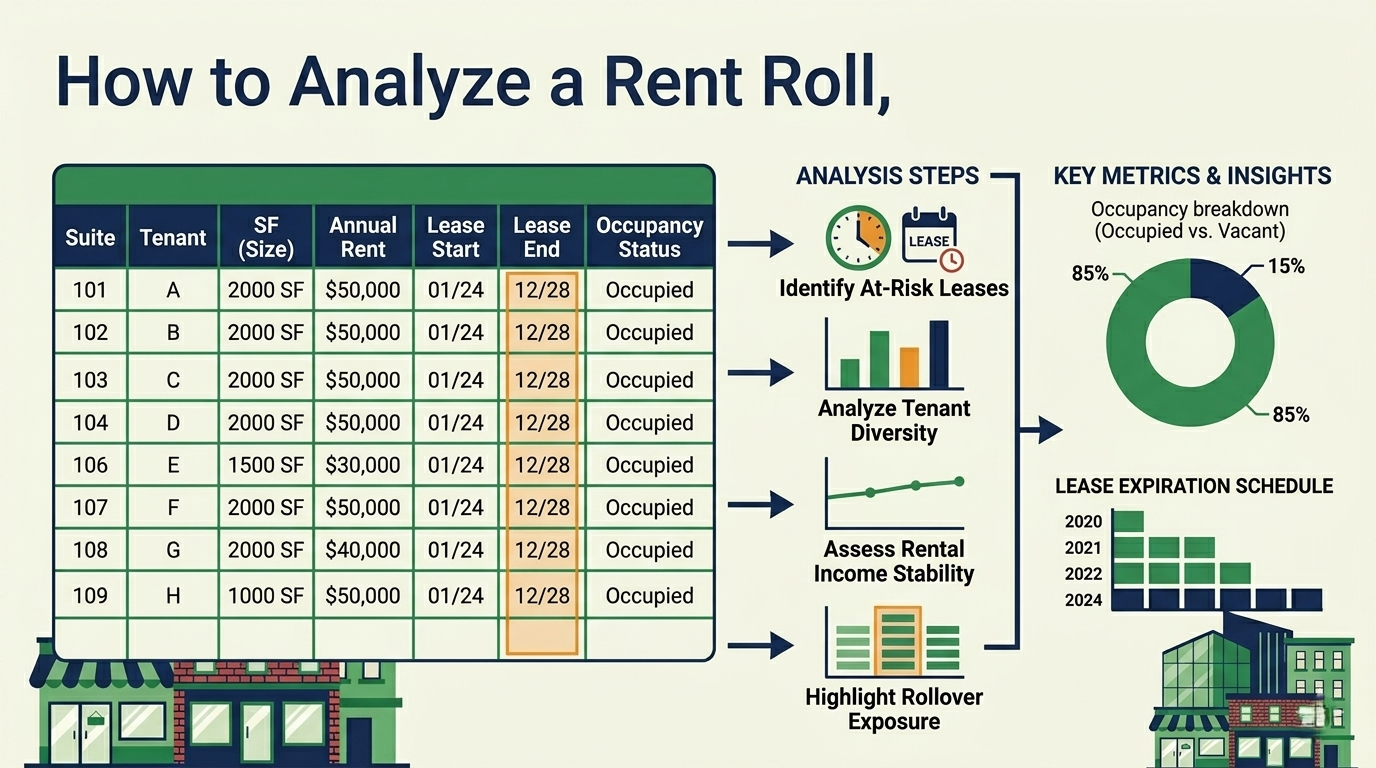
How to Analyze a Rent Roll: The CRE Underwriter's Complete Guide
Learn how to read and analyze a commercial real estate rent roll — what to look for, red flags to catch, key metrics to calculate, and how rent roll analysis feeds your proforma.
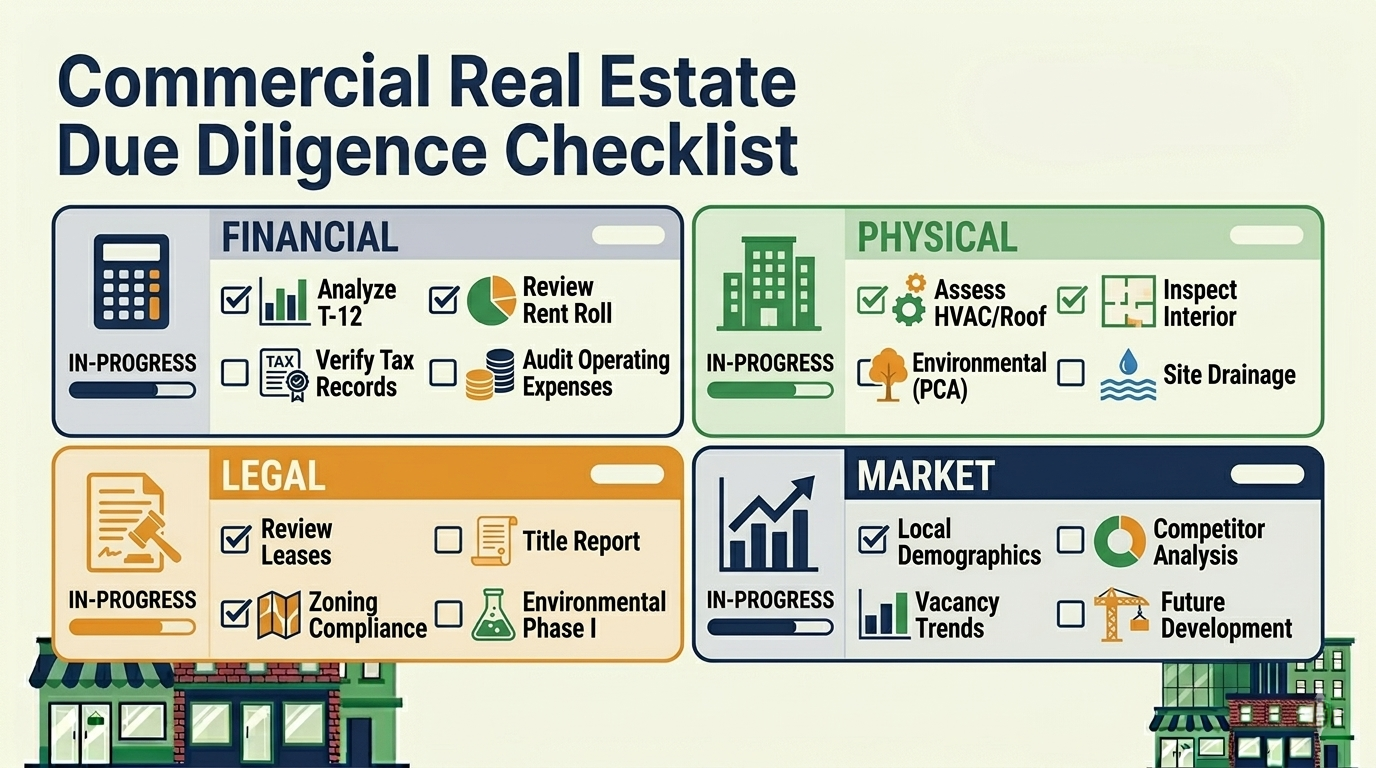
Commercial Real Estate Due Diligence Checklist: What to Verify Before Closing
Complete CRE due diligence checklist covering financial, physical, legal, environmental, and market verification — what to request, what to analyze, and what kills deals.
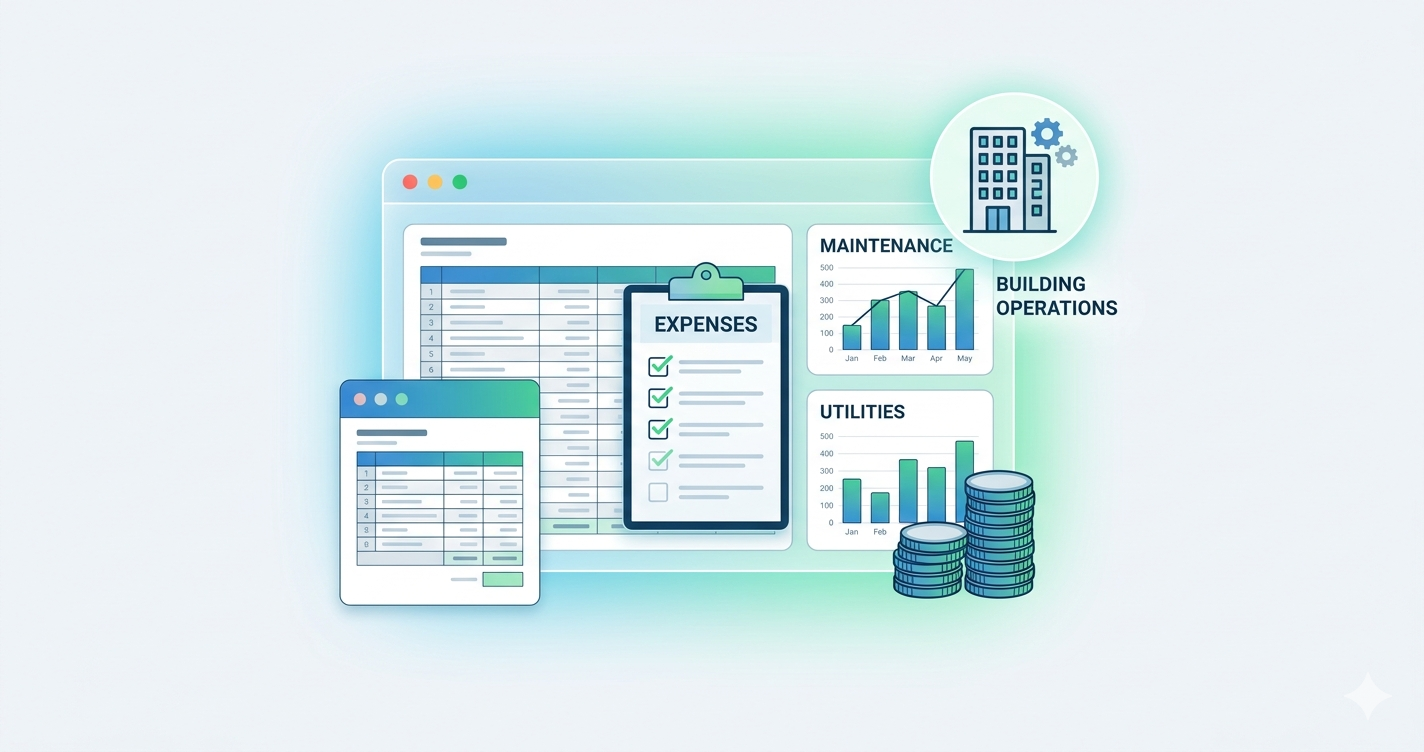
How to Calculate Operating Expenses for Commercial Real Estate
A complete guide to CRE operating expenses — categories, fixed vs. variable, below-the-line items, and how expense modeling affects your NOI, DSCR, and investment returns.