How to Underwrite a Value-Add Commercial Property
Value-add deals are where CRE investors make outsized returns — or take outsized losses. The difference between the two is almost always the underwriting.
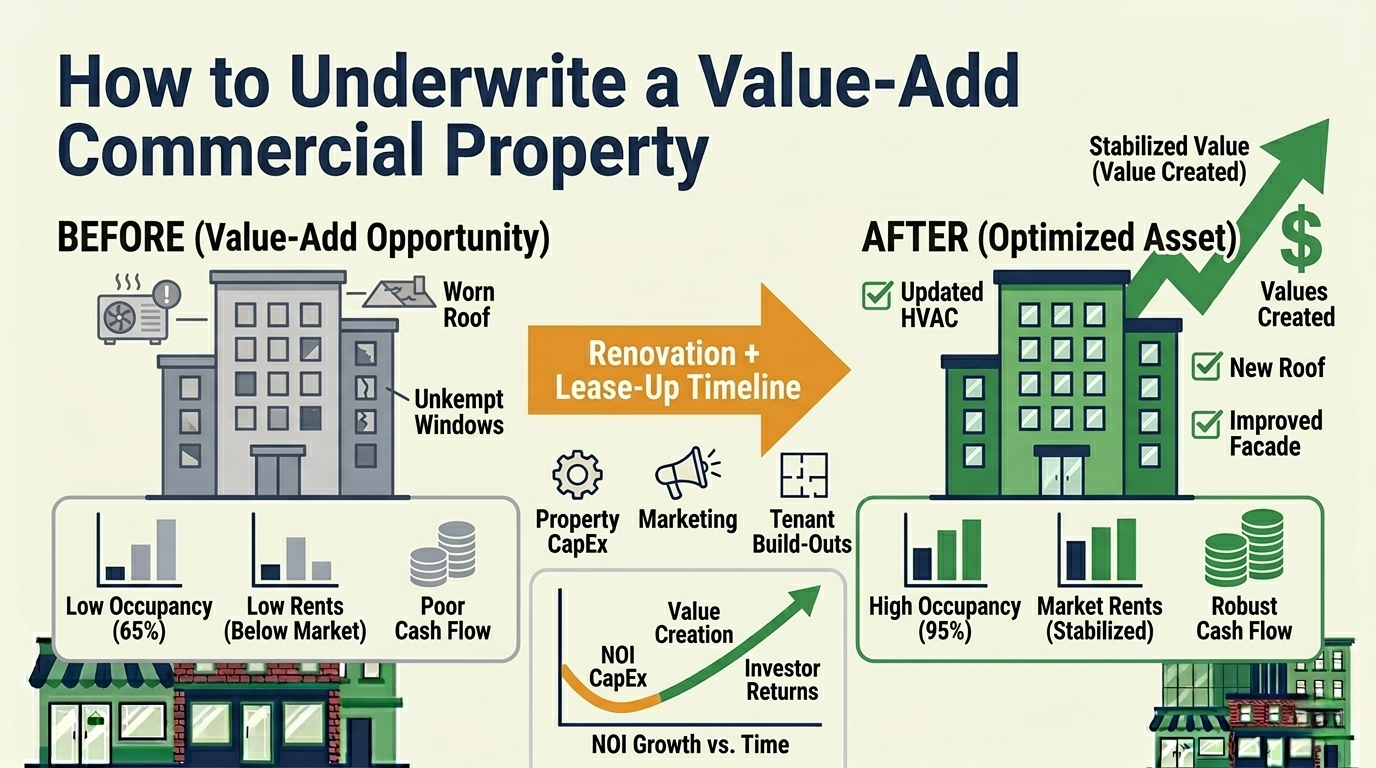
A value-add property is one where you can increase its value through active management: renovating common areas, re-leasing at higher rents, improving occupancy, restructuring leases, or reducing expenses. The math sounds simple. Buy at a 7 cap, stabilize to a 6 cap, sell at a higher price. The execution is where complexity lives.
This guide walks through the mechanics of underwriting a value-add deal step by step, with focuses on the modeling decisions that separate realistic projections from hopeful assumptions.
What Makes a Deal “Value-Add”?
Value-add sits between core (stabilized, fully-leased, low-risk) and opportunistic (ground-up development, major repositioning). A typical value-add deal has:
- Below-market occupancy (70-85%) that can be improved
- Below-market rents that can be raised after renovation
- Deferred maintenance that, once addressed, supports higher rents
- Lease-up opportunity from tenant turnover or upcoming expirations
- Expense inefficiencies that can be reduced with better management
The investor’s thesis is: invest capital to fix the problems, stabilize the property at market-rate income, and either hold for improved cash flow or sell at a lower cap rate.
Step 1: Establish “As-Is” Value
Before projecting what the property could be, establish what it is today.
As-Is NOI = Current T-12 NOI, normalized for your ownership (adjusted management fees, projected taxes, corrected deferred R&M).
As-Is Value:
Example:
- Normalized NOI: $280,000
- As-Is cap rate (higher because of vacancy/condition issues): 8.5%
- As-Is value: $280,000 / 0.085 = $3,294,118
The purchase price should be at or below this as-is value. You’re paying for the property in its current state, not for the value you’re going to create.
Step 2: Model the Renovation Budget
Value-add capital improvements typically include:
| Category | Description | Typical Cost Range |
|---|---|---|
| Common area renovation | Lobby, corridors, restrooms, signage | $10 – $40/SF of common area |
| Unit/suite renovation | Interior build-out for new or renewing tenants | $15 – $60/SF of suite |
| Building systems | HVAC, electrical, plumbing, roof | Varies widely — get bids |
| Exterior/curb appeal | Facade, landscaping, parking, lighting | $3 – $15/SF of site area |
| Amenity additions | Conference rooms, fitness, outdoor space | Lump sum, $50K – $500K |
Critical budgeting rules:
- Add a 10-15% contingency. Renovations always cost more than initial estimates.
- Include carrying costs during renovation. Debt service, taxes, and insurance don’t pause while you renovate.
- Phase the work. Renovate common areas first (drives leasing), then individual suites as tenants turn over.
Example:
- Purchase: $3,200,000
- Renovation: $450,000
- Closing costs: $80,000
- Carrying costs (6 months during renovation): $130,000
- Total basis: $3,860,000
Step 3: Project the Lease-Up
This is where most value-add underwriting goes wrong. Analysts model aggressive lease-up timelines and immediately jump to stabilized rents. Reality is messier.
Realistic Lease-Up Assumptions
Absorption rate: How fast can you fill vacant or newly-renovated space?
| Property Type | Typical Absorption |
|---|---|
| Industrial | 5,000 – 15,000 SF/month |
| Office (suburban) | 2,000 – 5,000 SF/month |
| Office (urban) | 3,000 – 8,000 SF/month |
| Retail (in-line) | 1,000 – 3,000 SF/month |
These are market-level rates. Your actual absorption depends on location, condition, marketing, and broker relationships.
Downtime between tenants: Even when you find a tenant, count on 2-4 months from LOI to lease commencement for typical office suites. Larger spaces can take 6-12 months for build-out.
Concession packages: New tenants in a renovated value-add property will still expect:
- 1-3 months free rent
- $15-40/SF in TI allowance (depending on property type)
- Leasing commissions of 4-6% of total lease value
Phased Rent Growth
Don’t model every suite at market rent from Day 1. Model a realistic ramp:
| Period | Occupancy | Avg. Rate |
|---|---|---|
| Acquisition (today) | 72% | $18.00/SF |
| Month 6 (renovation done) | 72% | $18.00/SF |
| Month 12 | 80% | $20.50/SF |
| Month 18 | 85% | $21.50/SF |
| Month 24 (stabilized) | 92% | $22.00/SF |
The stabilized rate of $22/SF reflects the market rate achievable AFTER renovation — not the current above-market hope.
Step 4: Calculate Stabilized Value
Once the property is renovated and leased up, calculate the stabilized NOI:
Stabilized EGI accounts for:
- Market-rate rents on all suites
- Stabilized vacancy (typically 5-8% for well-located property)
- Recovery income based on lease structures
- Other income at market rates
Stabilized OpEx accounts for:
- Reduced R&M (new systems, fewer repairs)
- Potentially higher taxes (reassessment to new value)
- Market-rate management fees
- Reduced utility costs (if systems were upgraded)
Stabilized Value:
The stabilized cap rate should be LOWER than the as-is cap rate because the property now has higher occupancy, better condition, and more durable income.
Example:
- Stabilized NOI: $410,000
- Stabilized cap rate: 6.75%
- Stabilized value: $410,000 / 0.0675 = $6,074,074
- Total basis: $3,860,000
- Value created: $2,214,074
Step 5: Calculate Returns
Unlevered Returns
The unlevered IRR tells you how the property performs on its own, without the amplifying effect of debt. For GP/LP deals, these returns flow through the waterfall distribution structure to determine each investor’s realized return.
Levered Returns
Factor in your debt: acquisition loan, construction/renovation draws, and permanent financing after stabilization. Our CRE loan types guide covers which debt structure fits each phase.
Target returns for value-add deals:
| Metric | Target Range |
|---|---|
| Unlevered IRR | 8 – 12% |
| Levered IRR | 14 – 22% |
| Equity Multiple | 1.5x – 2.5x (over 3-5 year hold) |
| Cash-on-Cash (stabilized) | 8 – 12% |
If your model can’t reach the bottom of these ranges with reasonable assumptions, the deal probably doesn’t work as value-add.
Common Value-Add Underwriting Mistakes
Mistake 1: Underestimating Lease-Up Time
The most expensive mistake. Every month of vacancy during lease-up bleeds cash: debt service accrues, taxes are due, insurance is paid, and the property generates no offsetting income from empty suites.
If your market takes 10 months to absorb 10,000 SF and you model 6 months, you’re wrong by $40,000+ in carrying costs.
Mistake 2: Ignoring the J-Curve
Value-add deals have a J-curve — returns are negative in the early period (renovation costs, lease-up expenses, sub-stabilized operations) before turning positive. If you’re pitching investors, model and display this honestly. If you’re modeling level cash flow from Day 1, your proforma isn’t realistic.
Mistake 3: Using Stabilized Returns to Justify the Purchase Price
You should buy at a price justified by the as-is valuation, not the stabilized one. The stabilized value includes value you haven’t created yet and risk you haven’t mitigated yet.
Mistake 4: Forgetting Tax Reassessment
In reassessment jurisdictions, your $3.2M purchase triggers a tax reassessment. After you stabilize and sell for $6M, the next buyer’s taxes go up again. Your buyer’s going-in cap rate effectively adjusts for this — so your exit cap rate assumption needs to account for potential tax increases.
Mistake 5: Single-Scenario Modeling
Value-add deals have more variables than stabilized assets. At minimum, model three scenarios:
| Scenario | Assumptions |
|---|---|
| Base case | Market absorption, budgeted renovation, projected rents |
| Downside | 50% slower absorption, 15% cost overrun, 5% lower rents |
| Upside | Faster absorption, rents exceed market, lower CapEx than budgeted |
If the downside scenario produces acceptable returns (or at least preserves capital), the deal has a margin of safety.
Key Takeaways
-
Buy at as-is value, create value through execution. The profit is in the spread between purchase basis and stabilized value.
-
Lease-up timing is the most sensitive variable. Stress-test your absorption assumptions aggressively — this is where most deals underperform.
-
Budget for reality, not hope. Include contingency, carrying costs, and market-rate concession packages in every model.
-
The J-curve is real. Year 1-2 will likely show negative or minimal returns. Show this honestly to investors.
-
Model three scenarios at minimum. If the downside is catastrophic, the deal’s risk-adjusted return doesn’t justify the complexity.
Eric Davis is the founder of Nordic Real Estate Services and creator of Solsten, a CRE analysis platform with multi-scenario modeling, exit scenario analysis, and ML-powered expense forecasting for value-add and stabilized deals. Start your analysis free →
Try Solsten Free
See everything we discussed in action — no credit card required.
Start Your Free AnalysisRelated Articles
How to Build a Real Estate Proforma: Step-by-Step Guide
Learn how to build a commercial real estate proforma from scratch — revenue projections, expense modeling, NOI, debt service, cash flow, and return metrics explained with examples.

Best Commercial Property Valuation Tools, Cap Rate Calculators & Value-Add vs. Core-Plus Strategy (2026)
A deep dive into the best commercial property valuation tools and cap rate calculators for 2026, plus how to choose between value-add and core-plus investment strategies.
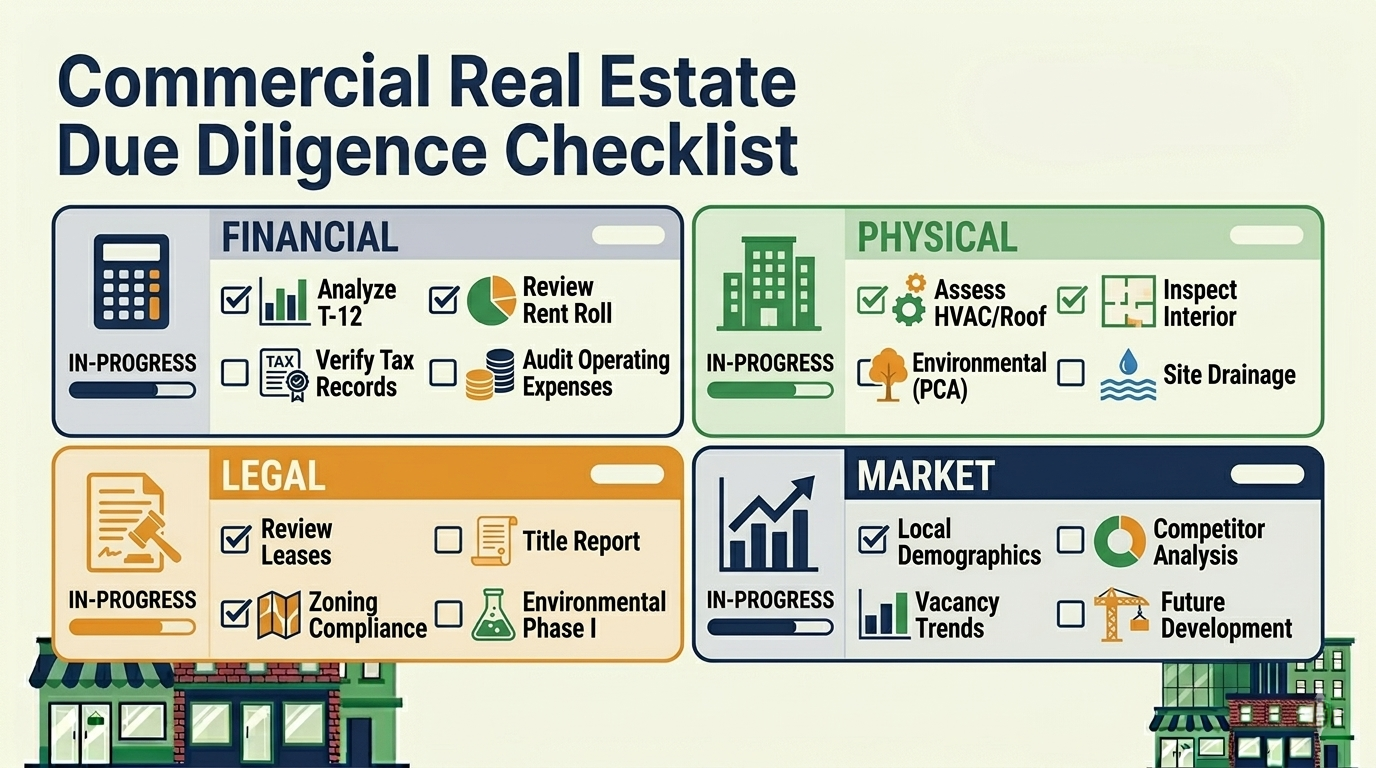
Commercial Real Estate Due Diligence Checklist: What to Verify Before Closing
Complete CRE due diligence checklist covering financial, physical, legal, environmental, and market verification — what to request, what to analyze, and what kills deals.