Real Estate Waterfall Distributions Explained: GP/LP Structures for CRE
If you’ve ever looked at a commercial real estate private placement memorandum and wondered why the distribution section is 15 pages long, you’re not alone. Waterfall structures are the mechanism that determines who gets paid, how much, and in what order.
Understanding waterfalls is critical whether you’re a GP structuring a deal, an LP evaluating one, or an analyst underwriting the economics for an investment committee.
This guide explains how waterfall distributions work, walks through the most common structures with real numbers, and covers the terms that separate experienced investors from first-timers.
What Is a Waterfall Distribution?
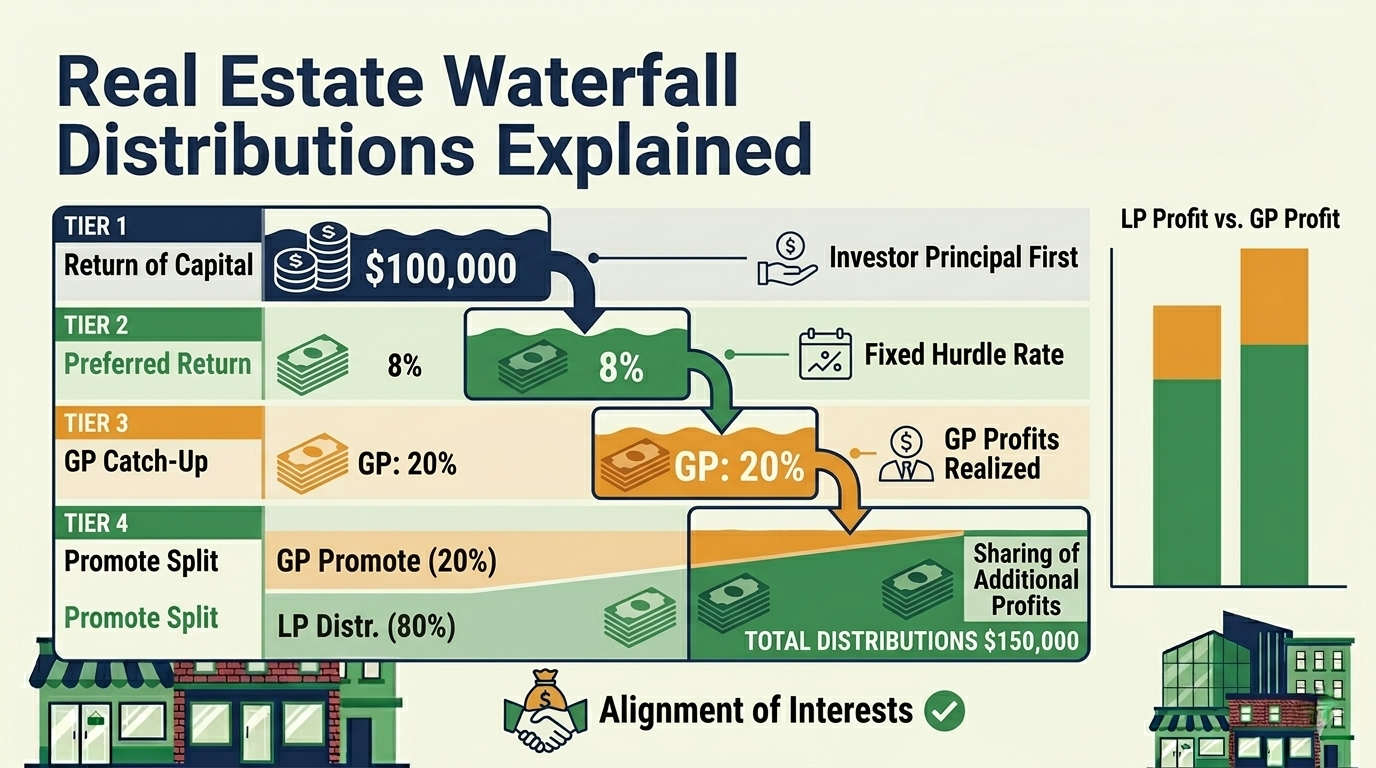
A waterfall distribution is a hierarchical system for dividing profits between investors (Limited Partners/LPs) and the deal sponsor (General Partner/GP). Cash flows “fall” through a series of tiers, with each tier defining how profits are split once a return threshold is met.
The simplest version:
- Return of capital — investors get their money back first
- Preferred return — investors earn a minimum return before the GP participates
- Catch-up — GP receives an accelerated share to “catch up” to a target split
- Residual split — remaining profits are divided by a negotiated percentage
This structure aligns incentives. The GP only earns outsized returns (the “promote”) after investors receive their preferred return. LPs get downside protection. GPs get upside incentive.
The Building Blocks
Return of Capital
Before any profit-sharing begins, investors receive their original equity investment back. This is the most senior claim in the waterfall.
Example: If an LP invests $1,000,000 and the property sells for $5,000,000 after debt payoff, the first $1,000,000 (plus any other LP equity) goes back to investors before any profits are distributed.
In most deals, return of capital is sacrosanct — it must be fully satisfied before any other tier activates.
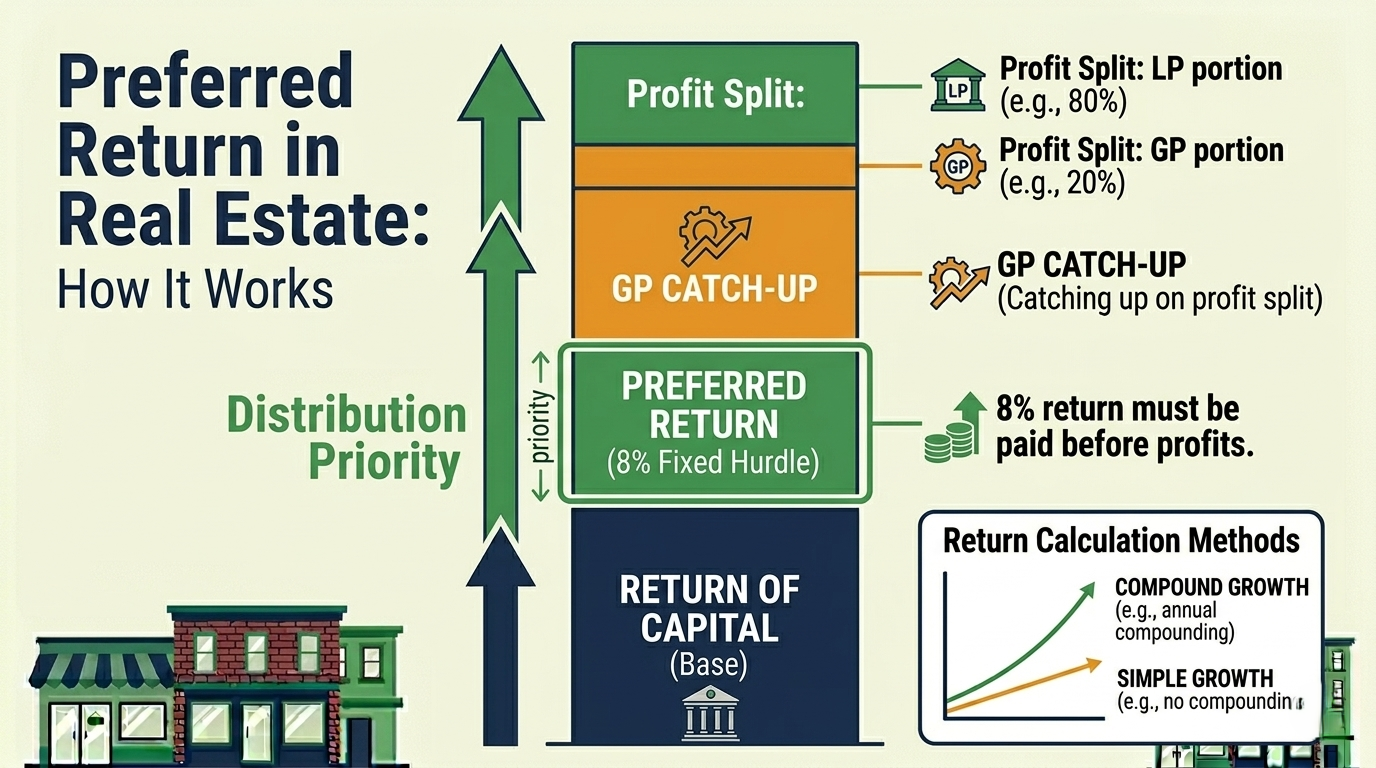
Preferred Return (“Pref”)
The preferred return is a minimum annual return on invested capital that accrues to LPs before the GP receives any profit share. Think of it as the cost of equity — the threshold return that investors expect for putting their money at risk.
Common pref rates: 6-10% annually, with 8% being the most common in CRE. For a deep dive into accrual methods, catch-up math, and lookback provisions, see our complete guide to preferred return.
Simple vs. compound:
- Simple preferred return: 8% × original equity per year. Clean, easy to calculate.
- Compound (cumulative) preferred return: Unpaid pref accrues and compounds. If the pref isn’t paid in Year 1, the shortfall earns interest.
Example:
LP invests $1,000,000 at 8% pref:
- Year 1: $80,000 pref owed
- Year 2: $80,000 pref owed
- Year 3: $80,000 pref owed
- Total pref before GP participates: $240,000 (simple) or $259,712 (compound)
If cash flow in Year 1 only covers $50,000 of the pref, the $30,000 shortfall carries forward. Under compounding, that $30,000 earns 8% in Year 2.
Catch-Up Provision
After the preferred return is satisfied, many deals include a catch-up tier where the GP receives 100% (or most) of distributions until they’ve “caught up” to a target profit split.
Why it exists: Without a catch-up, the GP’s share of total profits would be diluted by the pref. The catch-up ensures that over the life of the deal, the total profit split matches the target (e.g., 80/20).
Example with 100% GP catch-up:
After LP receives their 8% pref:
- GP receives 100% of next distributions until the GP has received 20% of all cumulative profits
- Once GP has caught up, remaining profits split 80/20
Partial catch-up (e.g., 50%): GP receives 50% and LP receives 50% during the catch-up phase. This is softer for LPs but takes longer for the GP to catch up.
Promote (Carried Interest)
The promote is the GP’s share of profits above the preferred return. It’s the GP’s incentive to create value beyond the baseline return.
In a standard deal with an 8% pref and 80/20 split, the GP’s 20% of profits above the pref is the promote. If the deal returns 18% IRR to investors, the GP’s promote on that excess return is where the real money is made.
Common Waterfall Structures
Structure 1: Simple Pref + Split
The most straightforward structure. Common in smaller deals and emerging sponsors.
| Tier | Distribution |
|---|---|
| 1. Return of capital | 100% to LPs |
| 2. Preferred return (8%) | 100% to LPs |
| 3. Remaining profits | 70% LP / 30% GP |
Pros: Easy to understand, easy to model. Cons: GP never fully “catches up” — their 30% only applies to profits above the pref, not total profits.
Structure 2: Pref + Catch-Up + Split (Industry Standard)
The most common institutional structure.
| Tier | Distribution |
|---|---|
| 1. Return of capital | 100% to LPs |
| 2. Preferred return (8%) | 100% to LPs |
| 3. GP catch-up | 100% to GP until GP has 20% of total profits |
| 4. Remaining profits | 80% LP / 20% GP |
Pros: Aligns total economics to an 80/20 deal. GP has strong incentive to exceed pref. Cons: The catch-up tier can surprise LPs — distributions swing from 100% LP to 100% GP temporarily.
Structure 3: Multi-Tier IRR-Based Waterfall
Used in institutional and value-add deals with multiple promote hurdles.
| Tier | IRR Threshold | Split |
|---|---|---|
| 1. Return of capital | — | 100% LP |
| 2. Preferred return | 0% – 8% | 100% LP |
| 3. First promote | 8% – 12% | 80% LP / 20% GP |
| 4. Second promote | 12% – 18% | 70% LP / 30% GP |
| 5. Above 18% | 18%+ | 60% LP / 40% GP |
Pros: GP is rewarded more for outsized performance. LP gets a larger share of moderate returns. Cons: Complex to model and explain. IRR thresholds require waterfall calculations that account for the timing of cash flows — not just totals.
Worked Example: 4-Tier Waterfall
Deal assumptions:
- Total equity: $2,000,000 (LP: $1,800,000 / GP: $200,000)
- Hold period: 5 years
- Total distributions: $4,000,000
- Total profit: $2,000,000
- Structure: 8% pref, 100% GP catch-up, 80/20 split
Step 1: Return of Capital
| Amount | |
|---|---|
| LP receives | $1,800,000 |
| GP receives | $200,000 |
| Remaining | $2,000,000 |
Step 2: 8% Preferred Return (Simple, 5 years)
| Amount | |
|---|---|
| LP receives | $720,000 |
| GP receives | $80,000 |
| Remaining | $1,200,000 |
Step 3: GP Catch-Up
Total profits distributed through Step 2: $720,000 + $80,000 = $800,000. GP has received $80,000 (10%). Target is 20% of total cumulative profits.
GP needs to reach 20% of all profits. Catch-up amount:
| Amount | |
|---|---|
| GP receives | $120,000 |
| Remaining | $1,080,000 |
Step 4: 80/20 Split on Remaining
| Amount | |
|---|---|
| LP receives | $1,080,000 × 80% = $864,000 |
| GP receives | $1,080,000 × 20% = $216,000 |
Final Summary:
| Return of Capital | Pref | Catch-Up | Split | Total | |
|---|---|---|---|---|---|
| LP | $1,800,000 | $720,000 | $0 | $864,000 | $3,384,000 |
| GP | $200,000 | $80,000 | $120,000 | $216,000 | $616,000 |
GP invested 10% of equity ($200K of $2M) and received 15.4% of total distributions ($616K of $4M). The promote earned them an extra 5.4% — that’s the value of the catch-up + split structure.
Key Terms You’ll Encounter
Lookback provision: At exit, recalculates the waterfall as if all distributions happened at once. Ensures the realized IRR matches the intended tier thresholds even if interim distributions were lumpy.
Clawback: If the GP received promote distributions that exceeded their entitlement (based on final realized returns), they must return the excess. Protects LPs from overpayment.
GP co-invest: The GP’s equity contribution (typically 5-20% of total equity). Higher GP co-invest aligns interests and gives LPs confidence the GP has skin in the game.
High-water mark: The preferred return must be fully satisfied — including any unpaid prior-period shortfalls — before the GP can earn promote. Resets are not allowed.
Distribution frequency: Quarterly is most common during the hold period. Sale/refinance proceeds trigger a separate waterfall calculation using cumulative returns.
Why Waterfalls Matter for Underwriting
When you underwrite a deal, the waterfall structure determines your actual returns as an investor — alongside the financing structure, which determines leverage and debt service. Two deals with identical property-level returns can produce very different investor outcomes depending on the waterfall.
A deal returning 15% property-level IRR with an aggressive waterfall (high promote, low pref) might deliver only 11% to LPs. The same property-level return with a conservative waterfall (low promote, higher pref) could deliver 13.5% to LPs.
Always model the full waterfall, not just property-level returns. Your IRR as an investor is what matters — and that’s determined by the waterfall.
Key Takeaways
-
The preferred return is not a guarantee. It’s a priority — LPs get paid first, but only if there’s cash to distribute.
-
Catch-up provisions swing distributions dramatically. Understand whether the catch-up is 50% or 100% and how it affects your interim cash flows.
-
Multi-tier IRR-based waterfalls reward outperformance. GPs earn higher promotes only when they deliver higher returns — good alignment.
-
Model the actual waterfall, not just property-level returns. Your realized return as an LP depends on the fee structure and distribution mechanics.
-
GP co-invest percentage signals alignment. The more the GP has at risk, the more aligned your interests.
Eric Davis is the founder of Nordic Real Estate Services and creator of Solsten, a CRE analysis platform with built-in waterfall modeling, multi-tier promote structures, and investor distribution tracking. Explore waterfall features →
Try Solsten Free
See everything we discussed in action — no credit card required.
Start Your Free AnalysisRelated Articles
Preferred Return in Real Estate: How It Works, How It's Calculated, and Why It Matters
Deep dive into preferred return mechanics in CRE — simple vs compound accrual, catch-up provisions, lookback clauses, and worked examples showing exactly how preferred return affects investor distributions.
Cap Rates, Do They Really Matter?
Cap rates are the most used metric in CRE — but relying on them alone is dangerous. Learn what cap rates miss and which metrics give you the full picture.

What Is Cash-On-Cash Return? Formula, Example, and Benchmark
Cash-on-cash return is annual pre-tax cash flow divided by total cash invested. This guide walks through the formula, a step-by-step CRE example, and what counts as a good benchmark.