Mastering IRR and NPV: How to Assess an Investment's True Profitability
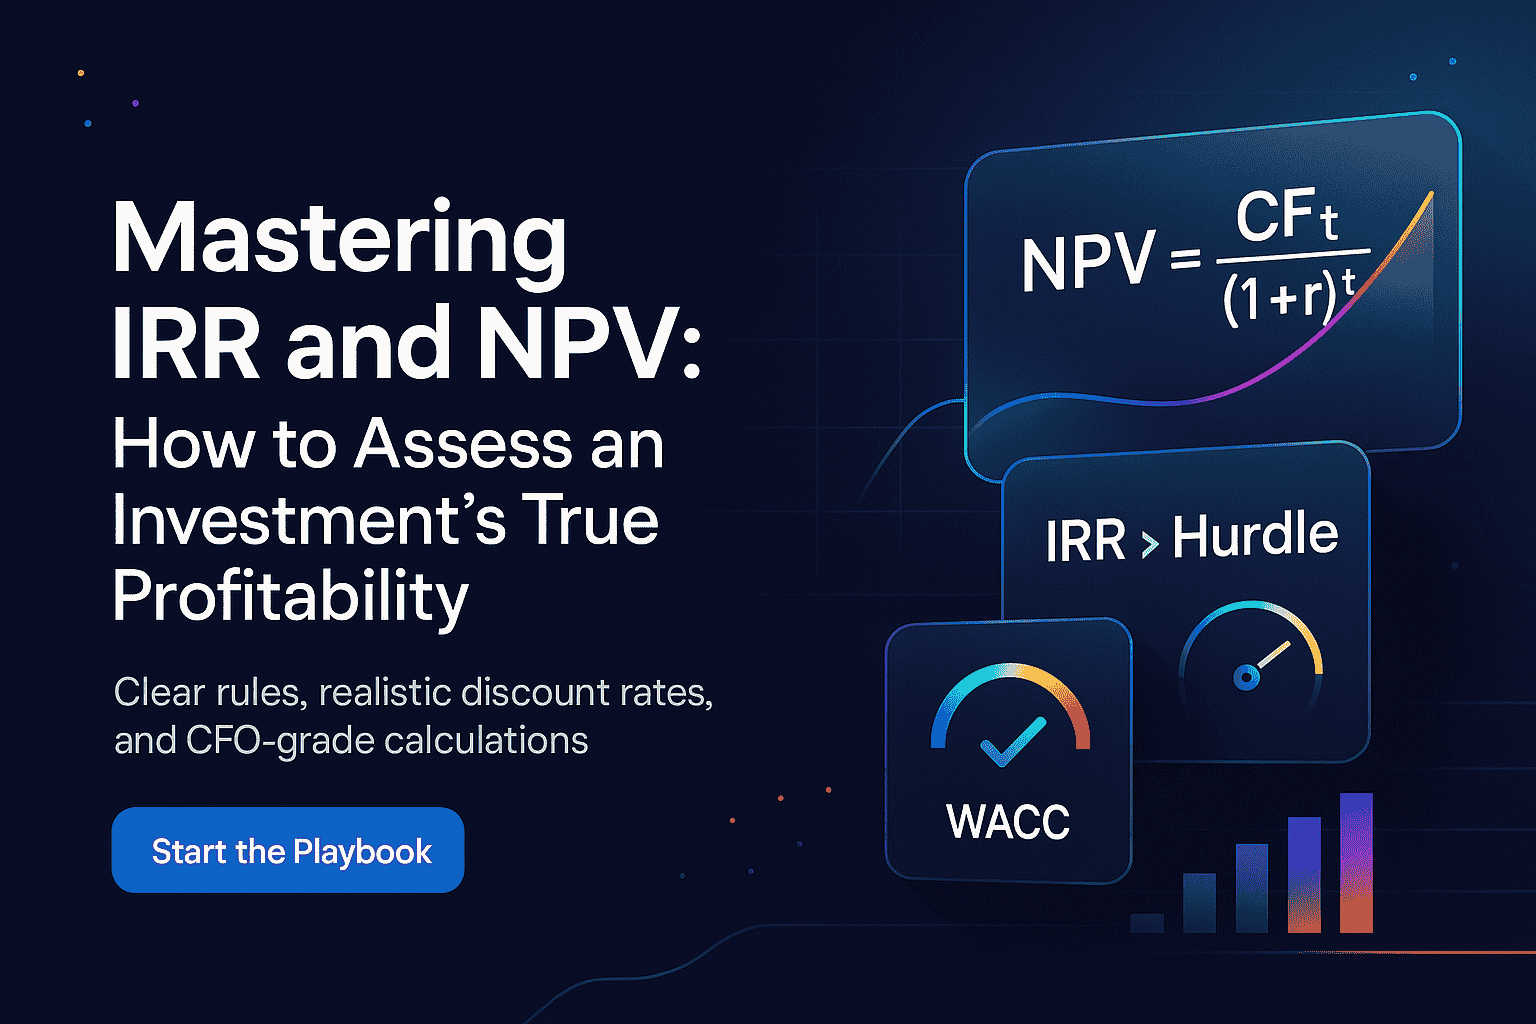
Need a fast, no-drama way to tell if a project really makes money? IRR and NPV are the two numbers that cut through the pitch.
- NPV shows how many dollars of value you create today at a risk-adjusted discount rate (often your Weighted Average Cost of Capital)
- IRR is the project’s implied annual return — handy for a quick “does it beat our hurdle rate?” check
This guide gives you the playbook: how to pick a defensible discount rate, run NPV/IRR step by step, when to favor NPV for mutually exclusive projects, and where MIRR fixes IRR’s reinvestment assumption.
Why IRR and NPV Are the Language of Smart Investing
When you strip the fluff from any pitch, two ideas stay standing: IRR and NPV. IRR speaks in percent — your project’s implied annual return. NPV speaks in today’s dollars — how much value you actually add after discounting.
Use IRR vs NPV together: one wins hearts (a clean %), the other wins budgets (cold cash).
Decision cues:
- If NPV > 0 at your risk-adjusted discount rate, the project creates value
- If IRR > hurdle, it clears your bar. When choices are mutually exclusive, rank by NPV
- Sanity check scale: a 20% IRR on peanuts may trail a 12% IRR on a big, steady asset
When to Use Which Metric
| Scenario | Primary | Secondary | Why |
|---|---|---|---|
| Mutually exclusive projects | NPV | IRR | NPV handles scale/timing cleanly |
| Capital-rationed budget | NPV | Profitability index | Max dollars of value per dollar |
| Irregular dates | XNPV/XIRR | IRR | Calendar-true math |
The Basics in Plain English
You’re pricing streams of cash across time. Discounted Cash Flow (DCF) takes every cash flow item and drags it back to today using a discount factor based on risk, inflation, and opportunity cost.
From there:
- Net Present Value says “how much value”
- Internal Rate of Return says “what annual % return”
What Is Net Present Value (NPV)?
NPV is the present value of all inflows minus outflows, discounted at a rate that reflects risk. If NPV’s positive, you’re creating wealth. If it’s negative, you’re burning it.
The NPV Formula
Where:
- $CF_t$ = expected cash flow at time $t$
- $r$ = risk-adjusted discount rate (often WACC)
- $T$ = project life
A quick mental model: Think of future cash as fruit across a river. The discount rate is the toll — inflation, risk, and your opportunity cost. After paying the toll on each trip, do you bring back more fruit than you paid to get there? If yes, NPV > 0.
What Is Internal Rate of Return (IRR)?
IRR is the discount rate that makes NPV exactly zero — the project’s implied annual return. Everyone understands a percent, but it can mislead with odd cash patterns.
Use cases:
- Quick screening against a hurdle rate
- Communicating with non-finance audiences
- Cross-checking NPV decisions
How IRR Is Solved in Practice
There isn’t a closed-form solution, so you iterate:
- Lay out the cash flow timeline (Year 0 investment negative)
- Try IRR; if dates aren’t annual, switch to XIRR
- If it errors, provide a reasonable guess (say 10–20%)
- Validate by plugging IRR back into your NPV formula (should be approximately 0)
Key intuition: If IRR > hurdle, you’re beating your next-best option. But mind the traps:
- Reinvestment assumption — IRR assumes interim cash reinvests at IRR (unlikely)
- Scale & timing — A tiny, fast payback can show a flashy IRR but low total value
Why Discounting Matters
Money today isn’t the same as money tomorrow. Three forces pull future cash down:
- Inflation — prices creep; purchasing power shrinks
- Risk — the cash may not show up
- Opportunity cost — your capital could earn returns elsewhere
Tie these into your risk-adjusted discount rate. Don’t guess — justify.
Choosing the Right Discount Rate
WACC (Weighted Average Cost of Capital)
WACC blends cost of equity (CAPM) and after-tax cost of debt, weighted by target capital structure:
Where:
- $R_e$ = cost of equity via CAPM
- $R_d$ = cost of debt (yield to maturity, net of tax)
- $T$ = tax rate
Hurdle Rate vs. Opportunity Cost
Your hurdle rate is a practical line in the sand. It should sit near WACC, plus any project-specific bumps.
- Too low? You’ll over-invest
- Too high? You’ll pass on winners
Checkpoint:
- Hurdle ≥ WACC formula output
- Clear memo on why it’s above/below corporate WACC
- Revisit annually (markets move)
Step-by-Step NPV Example
Hypothetical cash flows:
- Year 0: −$1,000 (capex)
- Year 1: +$400
- Year 2: +$500
- Year 3: +$600
At a 10% discount rate:
| Year | Cash Flow | Discount Factor | Present Value |
|---|---|---|---|
| 0 | −$1,000 | 1.000 | −$1,000.00 |
| 1 | +$400 | 1/1.10 | $363.64 |
| 2 | +$500 | 1/1.10² | $413.22 |
| 3 | +$600 | 1/1.10³ | $450.79 |
NPV ≈ $227.65 — the project creates value.
NPV Decision Rules
| Result | Meaning | Action |
|---|---|---|
| NPV > 0 | Creates value at chosen rate | Fund it (rank by NPV) |
| NPV = 0 | Break-even to hurdle | Consider strategic fit |
| NPV < 0 | Destroys value | Pass or redesign |
Step-by-Step IRR
Same cash flows: {−1,000; 400; 500; 600}. Running IRR gives approximately 21.6%. That’s the rate at which NPV = 0.
Always confirm IRR with your NPV at your actual hurdle rate — a high IRR doesn’t automatically mean the project is better than alternatives.
Common Pitfalls
- Mixing nominal/real — Don’t mix nominal cash flows with a real discount rate
- Forgetting midyear convention — If cash lands evenly through the year, adjust discounting accordingly
- Multiple IRRs — If cash flows change sign more than once (− + −), you may get multiple IRRs or none. Switch to NPV or MIRR
IRR vs NPV: Which Should You Trust?
Short answer: Trust NPV for ranking; use IRR for communication.
- Scale trap: A small pilot can show a flashy IRR with tiny NPV
- Timing trap: Early inflows inflate IRR; NPV prices the calendar fairly
- Mutually exclusive projects: The project with higher NPV typically adds more value — even when its IRR looks lower
MIRR: The Grown-Up IRR
Classic IRR assumes interim cash reinvests at IRR (optimistic). Modified IRR (MIRR) lets you set a finance rate and a reinvestment rate — usually your WACC.
Use MIRR for:
- Infrastructure and steady cash producers
- Cases where multiple sign changes make IRR unreliable
- Robust committee presentations alongside NPV
Sensitivity Analysis: Stress-Test Before You Commit
Assumptions breathe. Show how outcomes move when they do.
What If Discount Rate Shifts?
Build a one-variable table: NPV across discount rates (say 8–16%). If a 1–2% bump kills value, the project is fragile.
Best/Base/Worst Scenarios
- Base: Honest expectation
- Best: Upside within capacity constraints
- Worst: Price pressure, delays, cost overrun
Report NPV and IRR for each. If Worst is still NPV > 0, you’ve got a sturdy bet.
Beyond the Numbers: Real Options
Some projects come with choices — wait, scale, pivot, shut down. Those choices carry value that plain DCF can miss:
- Defer: Invest after a milestone reduces uncertainty
- Expand: Commit more capital if adoption beats plan
- Abandon: Sell or stop if unit economics break
These options protect downside and capture upside without paying for it upfront.
FAQs
What’s a “good” IRR? There’s no universal magic number. A “good” IRR exceeds your hurdle rate (often WACC plus a risk premium). In commercial real estate, levered IRR of 7–20% is typical depending on risk and hold period.
Can NPV be negative while IRR is high? Yes — this happens when the IRR exceeds your original hurdle but competes with a larger project that generates more total dollars of value.
When should I use MIRR instead of IRR? When cash flows change sign more than once, or when the reinvestment assumption at IRR is clearly unrealistic. MIRR gives a more grounded picture.
How long should my forecast be? Match it to the investment horizon. For real estate, that’s typically the expected hold period (5–10 years) plus a terminal value or sale assumption.
Tools like Solsten calculate IRR, NPV, and full proforma projections automatically — so you can focus on the deal, not the spreadsheet.
Related Articles
- What Does a Good IRR Look Like? — Levered vs. unlevered IRR ranges and benchmarks
- Cash-on-Cash Return Explained — The cash yield metric to pair with IRR
- Cap Rates: Do They Really Matter? — The quick-filter metric and what it misses
- Best Free Commercial Property Valuation Tools — Free platforms that calculate these metrics automatically
Explore Solsten
- DCF Analysis Software — IRR, NPV, and terminal value with ML-powered forecasting
- CRE Proforma Software — Full operating statements with exit scenario analysis
- All Features — See everything Solsten offers for CRE analysis
Try Solsten Free
See everything we discussed in action — no credit card required.
Start Your Free AnalysisRelated Articles
How to Build a Real Estate Proforma: Step-by-Step Guide
Learn how to build a commercial real estate proforma from scratch — revenue projections, expense modeling, NOI, debt service, cash flow, and return metrics explained with examples.
Stress-Testing a CRE Deal: The Sensitivity Analysis Guide for Underwriters
How to stress-test commercial real estate underwriting assumptions — exit cap rate, rent growth, expense inflation, DSCR at breakeven. Complete guide with worked examples and common mistakes.
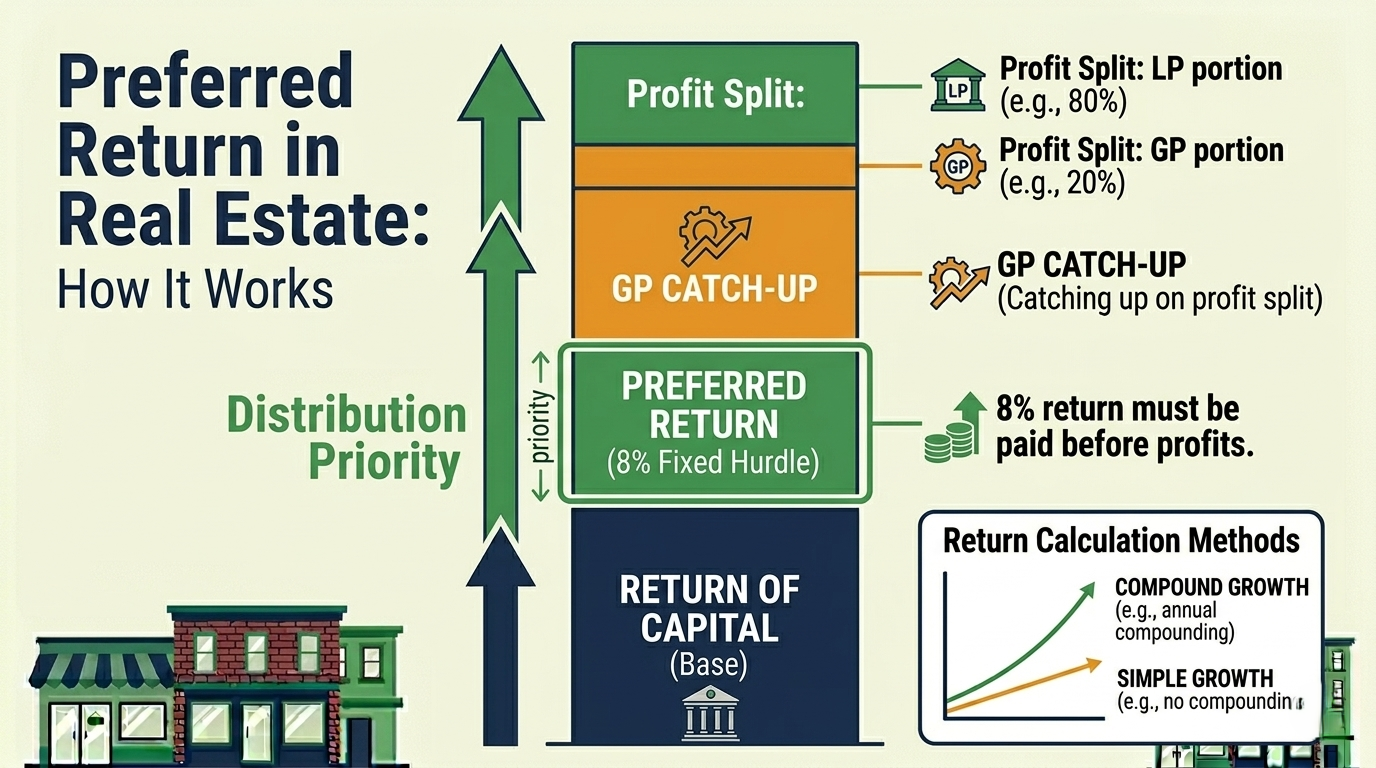
Preferred Return in Real Estate: How It Works, How It's Calculated, and Why It Matters
Deep dive into preferred return mechanics in CRE — simple vs compound accrual, catch-up provisions, lookback clauses, and worked examples showing exactly how preferred return affects investor distributions.