Stress-Testing a CRE Deal: The Sensitivity Analysis Guide for Underwriters
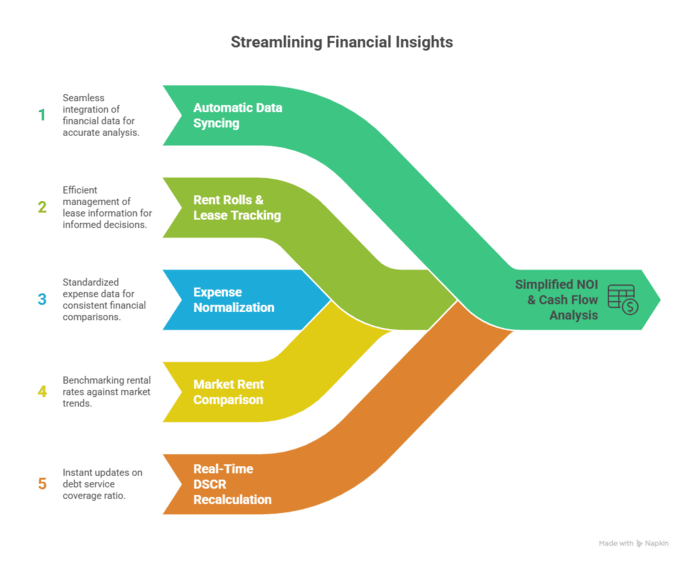
Every commercial real estate underwriting model is a stack of assumptions. Exit cap rate. Rent growth. Expense inflation. Vacancy. Renewal probability. Refinance rate. Any one of them, wrong by a few hundred basis points, can turn a 15% IRR into a 5% IRR — or into a capital call.
Sensitivity analysis is how you find out which assumptions matter. It is the difference between “the deal pencils” and “the deal pencils under conditions X, Y, and Z.” One is a bid. The other is a defensible thesis.
This guide walks through what sensitivity analysis is, the six assumptions every CRE deal should stress-test, how to build a sensitivity table that actually informs a decision, and the mistakes even experienced underwriters make.
What Is Sensitivity Analysis in CRE?
Sensitivity analysis is the discipline of asking: if this specific assumption in my model is wrong by X%, how does that change the deal?
A pro forma with a single set of assumptions produces a single set of outputs — a point estimate. That number is not wrong. It is just incomplete. What matters for a real bid is the distribution of outcomes: how does the return move when your inputs move?
Two deals with identical base-case IRRs can have completely different risk profiles. Deal A might have an IRR that ranges from 14% to 17% across a reasonable range of assumptions. Deal B’s IRR might range from -3% to 28% across the same range. Same base case. Very different bids.
Sensitivity analysis is the tool that surfaces this difference. It is not optional in institutional underwriting, and it should not be optional for anyone underwriting their own capital.
The Six CRE Assumptions Every Deal Should Stress-Test
Not every input in a proforma matters equally. Some assumptions barely move returns. Others carry the deal. These six carry the deal in almost every CRE asset class.
1. Exit Cap Rate
The single biggest driver of returns on a five-to-ten-year hold is what cap rate you sell into. A 25 basis point shift in exit cap on a $10M NOI property moves gross proceeds by roughly $10M — and terminal value is often 60-70% of your total return.
Stress the exit cap rate in ±50, ±100, and ±150 basis points from your base case. Any deal that only pencils in a compressed exit is a deal that requires cap rate compression to work, which is a market call, not an underwriting call.
2. Rent Growth
Small differences in annual rent growth compound dramatically over a hold period. 3% rent growth compounded over seven years produces 23% cumulative growth. 5% rent growth over the same period produces 40%. That 17 percentage point difference feeds into every year’s NOI and, by extension, terminal value.
Test rent growth at your base case ±100 basis points minimum, and stress-test with a two-year flat scenario. Real leases stall. Model it.
3. Operating Expense Inflation
Expense inflation is where a lot of models get lazy. Underwriters often apply a single blended inflation rate to all operating expenses. In reality, insurance, taxes, and utilities inflate at very different rates than payroll or repairs. And they are asymmetric — you rarely see expense deflation.
Stress-test with 3%, 4%, and 5% blended inflation. Anything that assumes expenses stay flat is optimistic to the point of malpractice.
4. Vacancy and Downtime at Lease Rollover
When a lease expires, four things happen: rent stops, tenant improvement allowance goes out the door, leasing commission goes out the door, and it takes months (sometimes years) to backfill the space at market rent.
Model this as a rollover event, not a percentage. If your Year-5 base case assumes six months of downtime on a 30,000 SF anchor tenant, stress it at 12 and 18 months. Backfill risk is one of the biggest hidden drags on office and retail underwriting.
5. Refinance Rate
For deals with floating rate loans, balloon maturities inside the hold period, or planned refinances after value-add work, the refinance rate is a live assumption. It is also the assumption most likely to have moved since you built the model.
Stress-test with rates 100, 200, and 300 basis points above your base case. If DSCR at refinance falls below 1.20x under a 200 basis point stress, you have a financing risk problem, not an underwriting problem.
6. Tenant Renewal Probability
For any lease expiring inside the hold period, the probability of renewal drives whether that space produces rent or downtime. A 90% renewal assumption is very different from a 70% renewal assumption — and most underwriters use 75-85% by default without much rigor.
Look at the tenant’s actual behavior. Publicly-traded tenants with credit ratings behave differently than local operators. National tenants with corporate leasing departments behave differently than owner-operators. Segment your rollover assumptions by tenant type.
Building a Sensitivity Table That Actually Informs a Decision
The classic sensitivity table is a two-variable grid showing how a chosen output (usually IRR or equity multiple) changes across ranges of two chosen inputs. Here is a worked example.
Base case assumption set:
- Exit cap rate: 6.50%
- Rent growth: 3.5% annual
- Base case IRR (levered, 7-year hold): 15.4%
Sensitivity table: Exit Cap Rate × Rent Growth
| Rent 2.5% | Rent 3.5% (base) | Rent 4.5% | |
|---|---|---|---|
| Exit 6.00% | 15.8% | 17.9% | 20.1% |
| Exit 6.50% (base) | 13.4% | 15.4% | 17.5% |
| Exit 7.00% | 11.1% | 13.0% | 15.0% |
| Exit 7.50% | 8.9% | 10.7% | 12.6% |
Reading this: your base case is 15.4%. A 100 basis point cap rate expansion cuts your IRR to 10.7% — still positive but well below institutional hurdles. Rent growth at 2.5% (a full point below your base) at that same exit cap rate produces 8.9%. If both stress cases happen together, you get 8.9% — which for a levered CRE deal is probably below your cost of capital.
The number that matters here is not the base case. It is the worst-case corner in the bottom-left. That is the number you have to defend when you go in front of a credit committee or an LP group.
For deals with more than two live variables, a tornado chart ranks the impact of each variable on the output, showing which ones move the deal most. Exit cap rate almost always tops the list. Rent growth is usually second. Everything else is fighting for third.
Common Sensitivity Analysis Mistakes
Mistake 1: Treating Variables as Independent
Interest rates and cap rates are correlated in the long run. So are rent growth and vacancy. When you stress-test a 200 basis point rate hike, you probably should also be modeling a 50-100 basis point cap rate expansion in the same scenario — not as separate stress cases. A single-variable stress test that ignores correlated moves understates real risk.
Mistake 2: Symmetric Ranges
Underwriters default to symmetric stress tests: base case ±X%. But most CRE variables have asymmetric distributions. Rent growth has a floor near zero (in nominal terms) but no fixed ceiling. Cap rates can expand faster than they compress. Expense inflation almost never goes negative.
Stress-test asymmetrically when the underlying variable is asymmetric.
Mistake 3: Only Stressing Exit, Not Hold Period
Everyone stresses the exit cap rate. Fewer underwriters stress-test what happens if their year-3 renewal falls through and the anchor tenant vacates for 18 months mid-hold. That kind of hold-period stress can trigger a debt service coverage failure long before the exit — meaning you never even get to the exit scenario.
Model the interim years too, especially DSCR at every year of the hold.
Mistake 4: Missing DSCR Breakeven Analysis
DSCR sensitivity is different from IRR sensitivity. DSCR is a constraint, not an output. If your DSCR breaches your loan covenant, the lender takes the property. It does not matter what your IRR would have been if that had not happened.
Every stress-test scenario should include a DSCR check for every year of the hold. If DSCR falls below 1.10x at any point in any reasonable stress case, you have a financing risk problem that needs to be addressed before the deal closes.
Mistake 5: No Downside Case in Your Investor Memo
If your OM shows only base case returns, you have not done sensitivity analysis for your investors — you have done it for yourself. Institutional LPs increasingly expect to see downside, base, and upside cases side by side, with the drivers of each spelled out. It is the difference between “here’s what I think will happen” and “here’s the range I’m underwriting.”
How Sensitivity Feeds Deal Decisions
Sensitivity analysis is only useful if it changes what you do. In practice, it should inform four decisions:
1. Walk-away thresholds. Before you get emotionally invested in a deal, set the minimum acceptable return under a defined stress case. If IRR under a 100 basis point exit-cap expansion falls below your walk-away threshold, you either need a lower bid or a different deal.
2. Price adjustment. If a sensitivity table shows the deal only works in tight bands of exit cap and rent growth, the bid needs to come down to widen those bands. Sensitivity analysis is a pricing tool as much as a risk tool.
3. Financing structure. If DSCR fails under moderate stress, the leverage is too high, the amortization is too short, or the term is too long. Fix the structure before you close, not after.
4. Reserve requirements. Deals with heavy rollover risk in year 3-5 need cash reserves in the model. Sensitivity analysis on rollover downtime shows you how much.
Sensitivity by Property Type
Different property types have different dominant risk variables. Focus your stress-testing effort where it matters most.
- Multifamily: rent growth and exit cap rate dominate. Renewal probability is less critical because turnover is high and expected. Concessions and downtime cycles matter more than long-lease rollover.
- Office: renewal probability, TI budget, and downtime dominate. A single anchor tenant rollover can flip a deal. Cap rates matter but often less than the leasing risk.
- Industrial: exit cap rate and rent-to-market spread dominate. Below-market rent rolls are big value-add opportunities but require realistic mark-to-market assumptions.
- Retail: tenant credit and co-tenancy risk dominate. Anchor tenant loss can trigger co-tenancy clauses that cascade through the rent roll. Model rollover risk aggressively.
- Self-storage: rate growth and occupancy sensitivity dominate. Almost no lease rollover risk because leases are month-to-month, but rate-setting elasticity is a critical stress variable.
What Software Handles Sensitivity Well
Excel handles sensitivity via Data Tables — a well-known but manual feature that many analysts never fully learn. Two-variable tables work, but multi-variable analysis quickly becomes brittle. Any structural change to the underlying model tends to break the sensitivity table.
ARGUS Enterprise has native sensitivity analysis and data tables built into its DCF module. Depth is real, but the learning curve is steep and the cost is institutional. Most independent underwriters and mid-market firms cannot justify the seat license just for the sensitivity tooling.
Solsten models multiple exit years in parallel by default — year 5, 7, 10, and any other year in your hold period — with unlevered IRR, levered IRR, equity multiple, and gross proceeds side by side. Combined with the 15-factor risk scoring and ML-powered expense forecasting, sensitivity is a first-class output rather than a manual afterthought. The free tier gets you a full first analysis with exit scenarios enabled; paid plans from $99/mo add unlimited assignments.
FAQs
What is the difference between sensitivity analysis and scenario analysis? Sensitivity analysis changes one or two variables at a time to isolate their impact on returns. Scenario analysis defines an entire coherent alternate world — say, a “2008 recession” scenario — and moves multiple correlated variables together. Sensitivity is a diagnostic tool. Scenarios are a storytelling tool. Institutional underwriting uses both.
How many variables should I stress-test? For most CRE deals, four to six variables cover 90%+ of the risk: exit cap rate, rent growth, expense inflation, vacancy/downtime, refinance rate, and tenant renewal probability. Adding more variables produces diminishing returns and can obscure the drivers that actually matter.
What is a reasonable stress case for exit cap rates? As a rule of thumb, stress-test at ±50, ±100, and ±150 basis points from your base case. If the deal only works in a compressed-cap-rate future, you are effectively making a market call, not an underwriting call. That is legitimate — but it should be explicit.
Does sensitivity analysis matter for stabilized properties? Yes, though the variables shift. On a stabilized, long-lease property, exit cap rate and refinance rate dominate. Rent growth and rollover matter less because rents are locked in. But because the deal is more concentrated on the exit, small changes in that exit assumption move returns proportionally more.
Can Saga (Solsten’s AI assistant) help with sensitivity analysis? Saga is grounded in your actual property model data. You can ask “what happens to my year-7 IRR if the exit cap goes from 6.5 to 7.5” and get an answer computed from your underlying model — not a hallucinated estimate. It complements the built-in parallel exit scenarios rather than replacing them.
Related Articles
- NNN Lease Recovery Analysis: How to Calculate Expense Pass-Throughs — The recovery structures that flow into your sensitivity model
- How to Underwrite a Value-Add Commercial Property — Where sensitivity analysis is most critical
- How to Build a Real Estate Proforma — The proforma structure your sensitivity table sits on top of
- What Does a Good IRR Look Like? — Benchmark ranges to interpret your sensitivity output
- Load-Bearing Math for AI CRE Underwriting — Why deterministic calculations matter for stress-testing
Explore Solsten
- CRE Underwriting Software Features — Parallel exit scenarios, ML forecasting, 15-factor risk scoring, and Saga AI
- Real Estate DCF Analysis — Multi-year cash flow projection with terminal value modeling
- Plans & Pricing — Free tier + paid plans from $99/mo
Try Solsten Free
See everything we discussed in action — no credit card required.
Start Your Free AnalysisRelated Articles
How to Build a Real Estate Proforma: Step-by-Step Guide
Learn how to build a commercial real estate proforma from scratch — revenue projections, expense modeling, NOI, debt service, cash flow, and return metrics explained with examples.
Cap Rates, Do They Really Matter?
Cap rates are the most used metric in CRE — but relying on them alone is dangerous. Learn what cap rates miss and which metrics give you the full picture.

How to Value an Income Property with Solsten's Free Tier
A practical walkthrough of NOI, cap rate, and DSCR math for income properties, worked through Solsten's free tier — the free CRE valuation platform for investors who want institutional math without ARGUS pricing.