Real Estate DCF Analysis Made Simple
Compass automates discounted cash flow analysis for commercial real estate. Get IRR, NPV, equity multiples, and terminal value calculations — with ML-powered forecasting that learns from your property data.
What Is DCF Analysis in Real Estate?
Discounted Cash Flow (DCF) analysis calculates the present value of a property by projecting all future cash flows and discounting them back at an appropriate rate of return.
It answers the fundamental question: "What is this property worth today, given everything I expect it to earn?"
Unlike simple cap rate analysis, DCF accounts for the time value of money, varying cash flows, lease rollovers, rent escalations, vacancy periods, and the terminal sale — giving you a far more accurate picture of investment value.
The DCF Formula
- CFₜ = Cash flow in year t (NOI minus debt service)
- r = Discount rate (your required rate of return)
- n = Hold period in years
- Terminal Value = Sale price at exit (NOI ÷ terminal cap rate)
Compass computes all of this automatically from your property data.
Return Metrics Compass Calculates
Every metric institutional investors and lenders expect to see.
Internal Rate of Return
The annualized return that makes NPV = 0. Compass calculates both leveraged and unleveraged IRR, with Going-Forward and Since Acquisition variants.
Net Present Value
The difference between present value of cash flows and your initial investment. Positive NPV = the deal exceeds your required return.
Equity Multiple
Total distributions divided by total equity invested. A 2.0× equity multiple means you doubled your money.
Cash-on-Cash Return
Annual pre-tax cash flow divided by total cash invested. The real-world yield on your out-of-pocket investment.
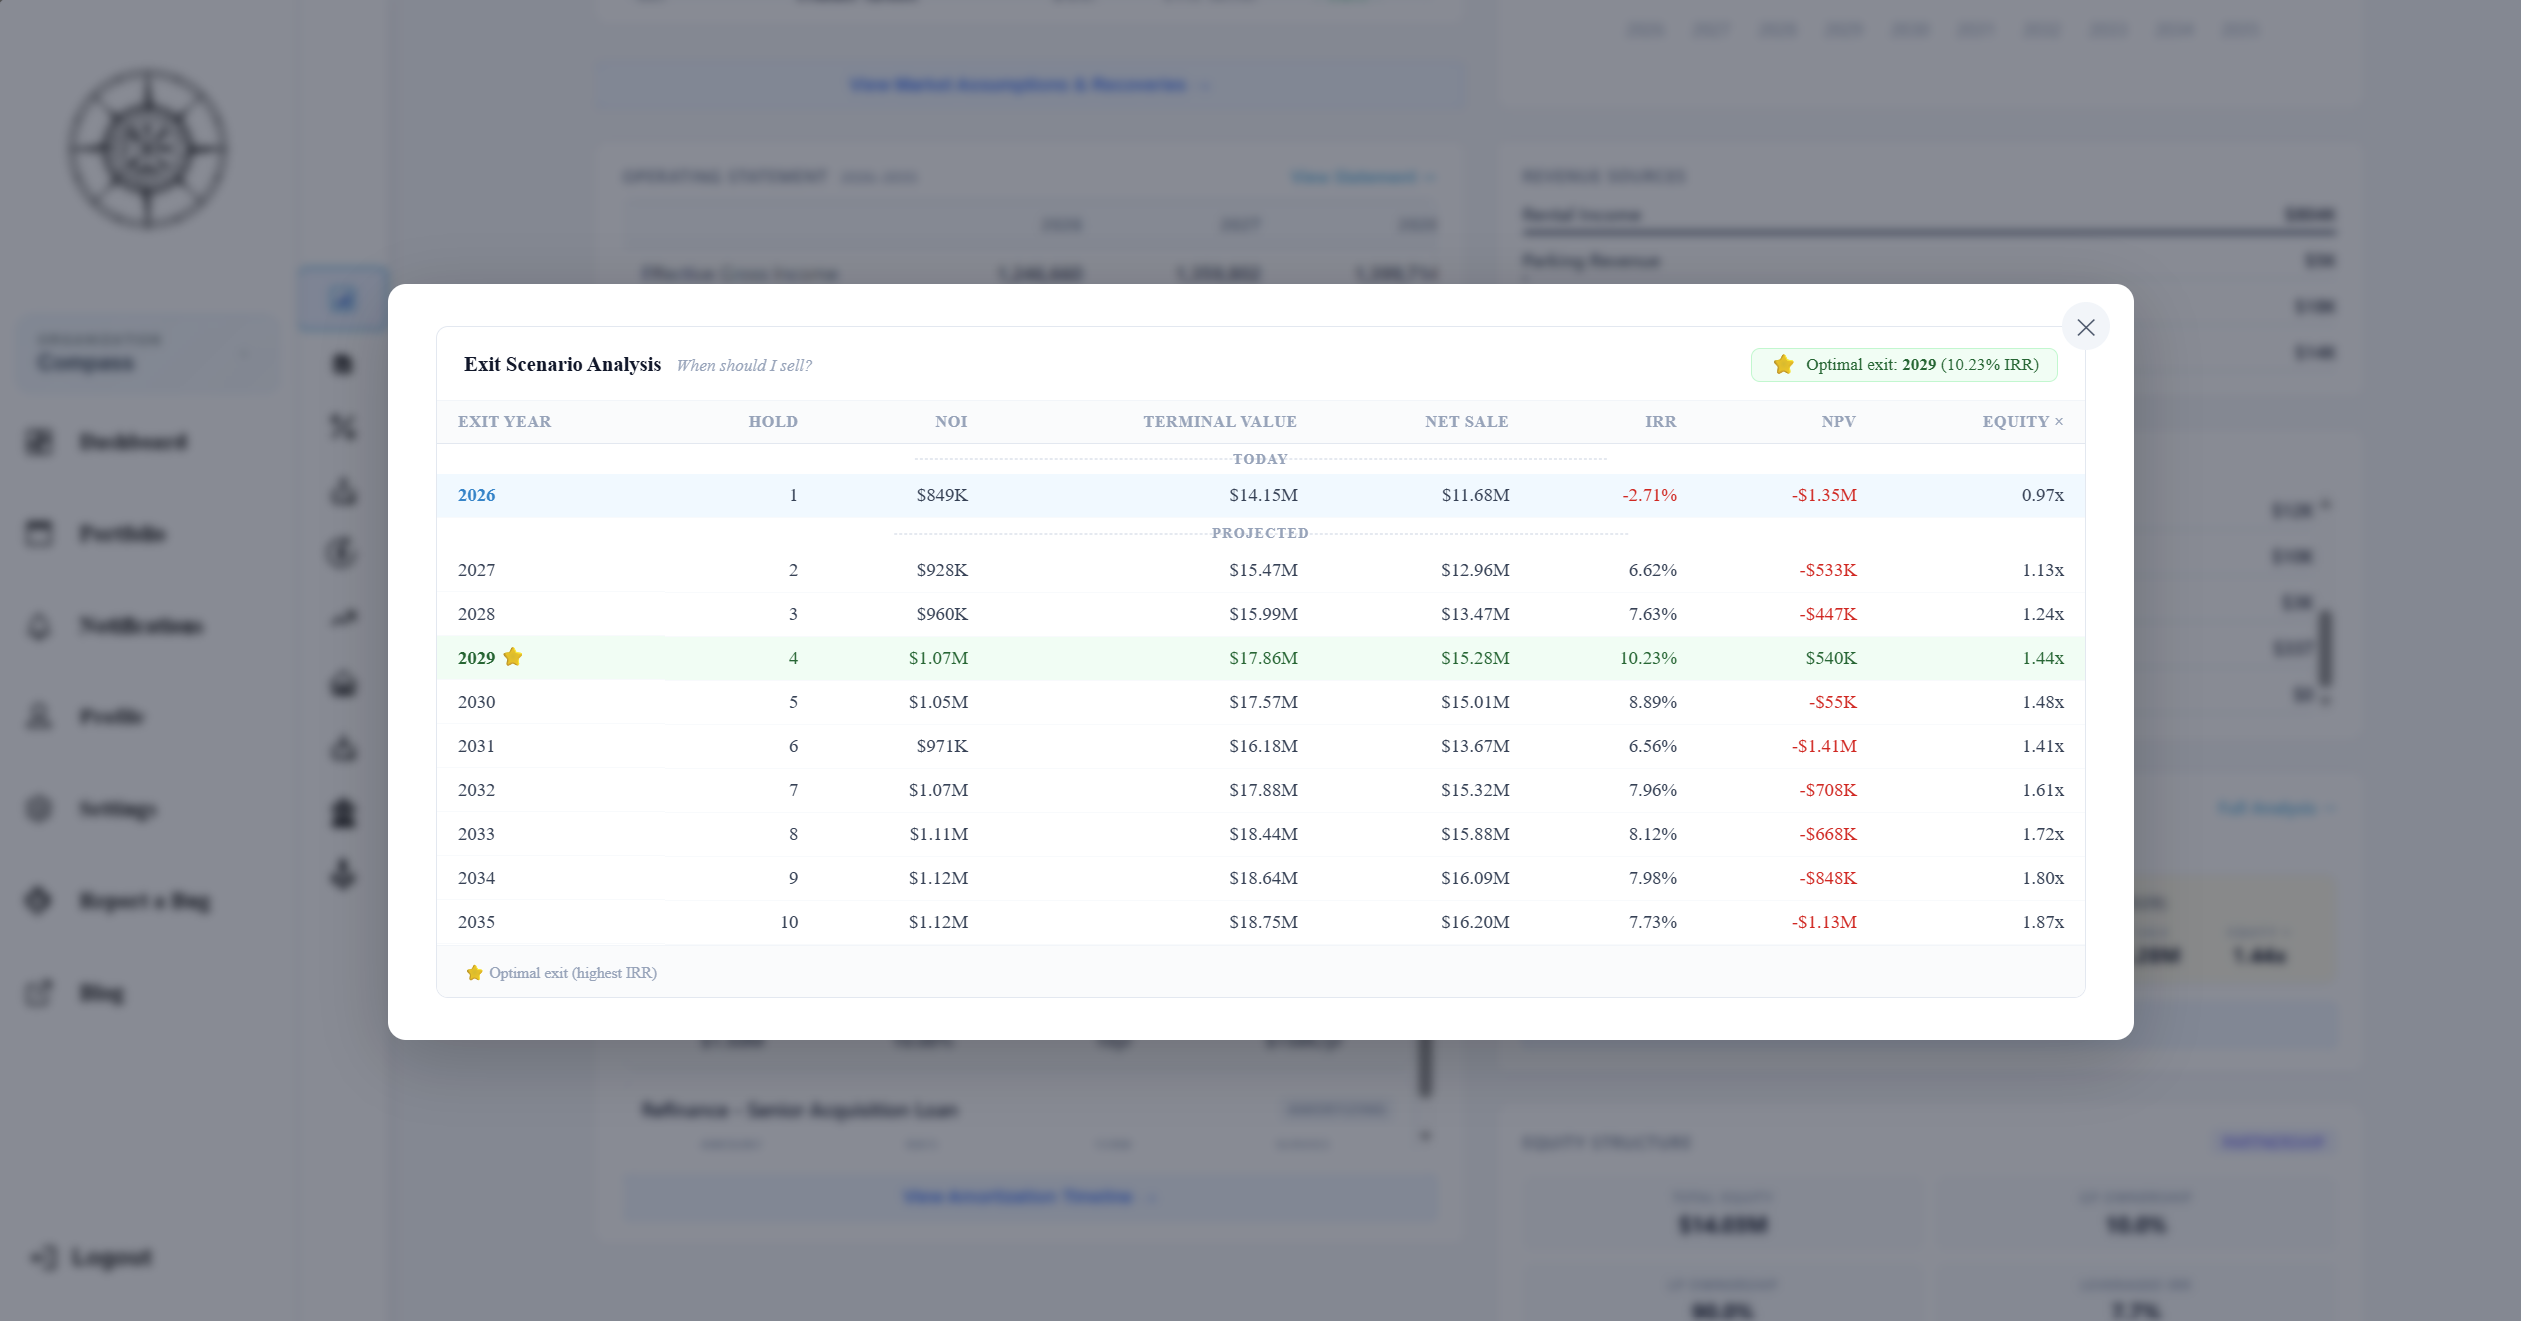
Exit Scenario Optimization
Compass doesn't just calculate returns for your target hold period — it computes IRR, NPV, and equity multiple for every possible exit year.
The Exit Scenario Table highlights your optimal exit year with a star icon, flags loan maturity dates, and shows historical vs. projected periods.
This helps you answer: "Should I hold another year, or sell now?"
Why Compass for DCF Analysis
ML-Calibrated Assumptions
Expense growth rates and rent projections are calibrated from your actual payment history — not just static percentages.
Dual-Metric Returns
Going-Forward returns (from today) and Since Acquisition returns (from purchase date) — with automatic lease coverage gating.
Period-Average Occupancy
ARGUS-standard weighted-average occupancy over billing periods, not point-in-time snapshots. Captures mid-month lease events accurately.
Run Your First DCF Analysis Free
Enter your property data and get IRR, NPV, equity multiple, exit scenarios, and a complete operating statement — automatically.
No credit card required. Full access during beta.