Institutional-Grade CRE Analysis. Surprisingly Simple.
From initial underwriting to exit scenario modeling, Compass covers every step of the commercial real estate analysis lifecycle.
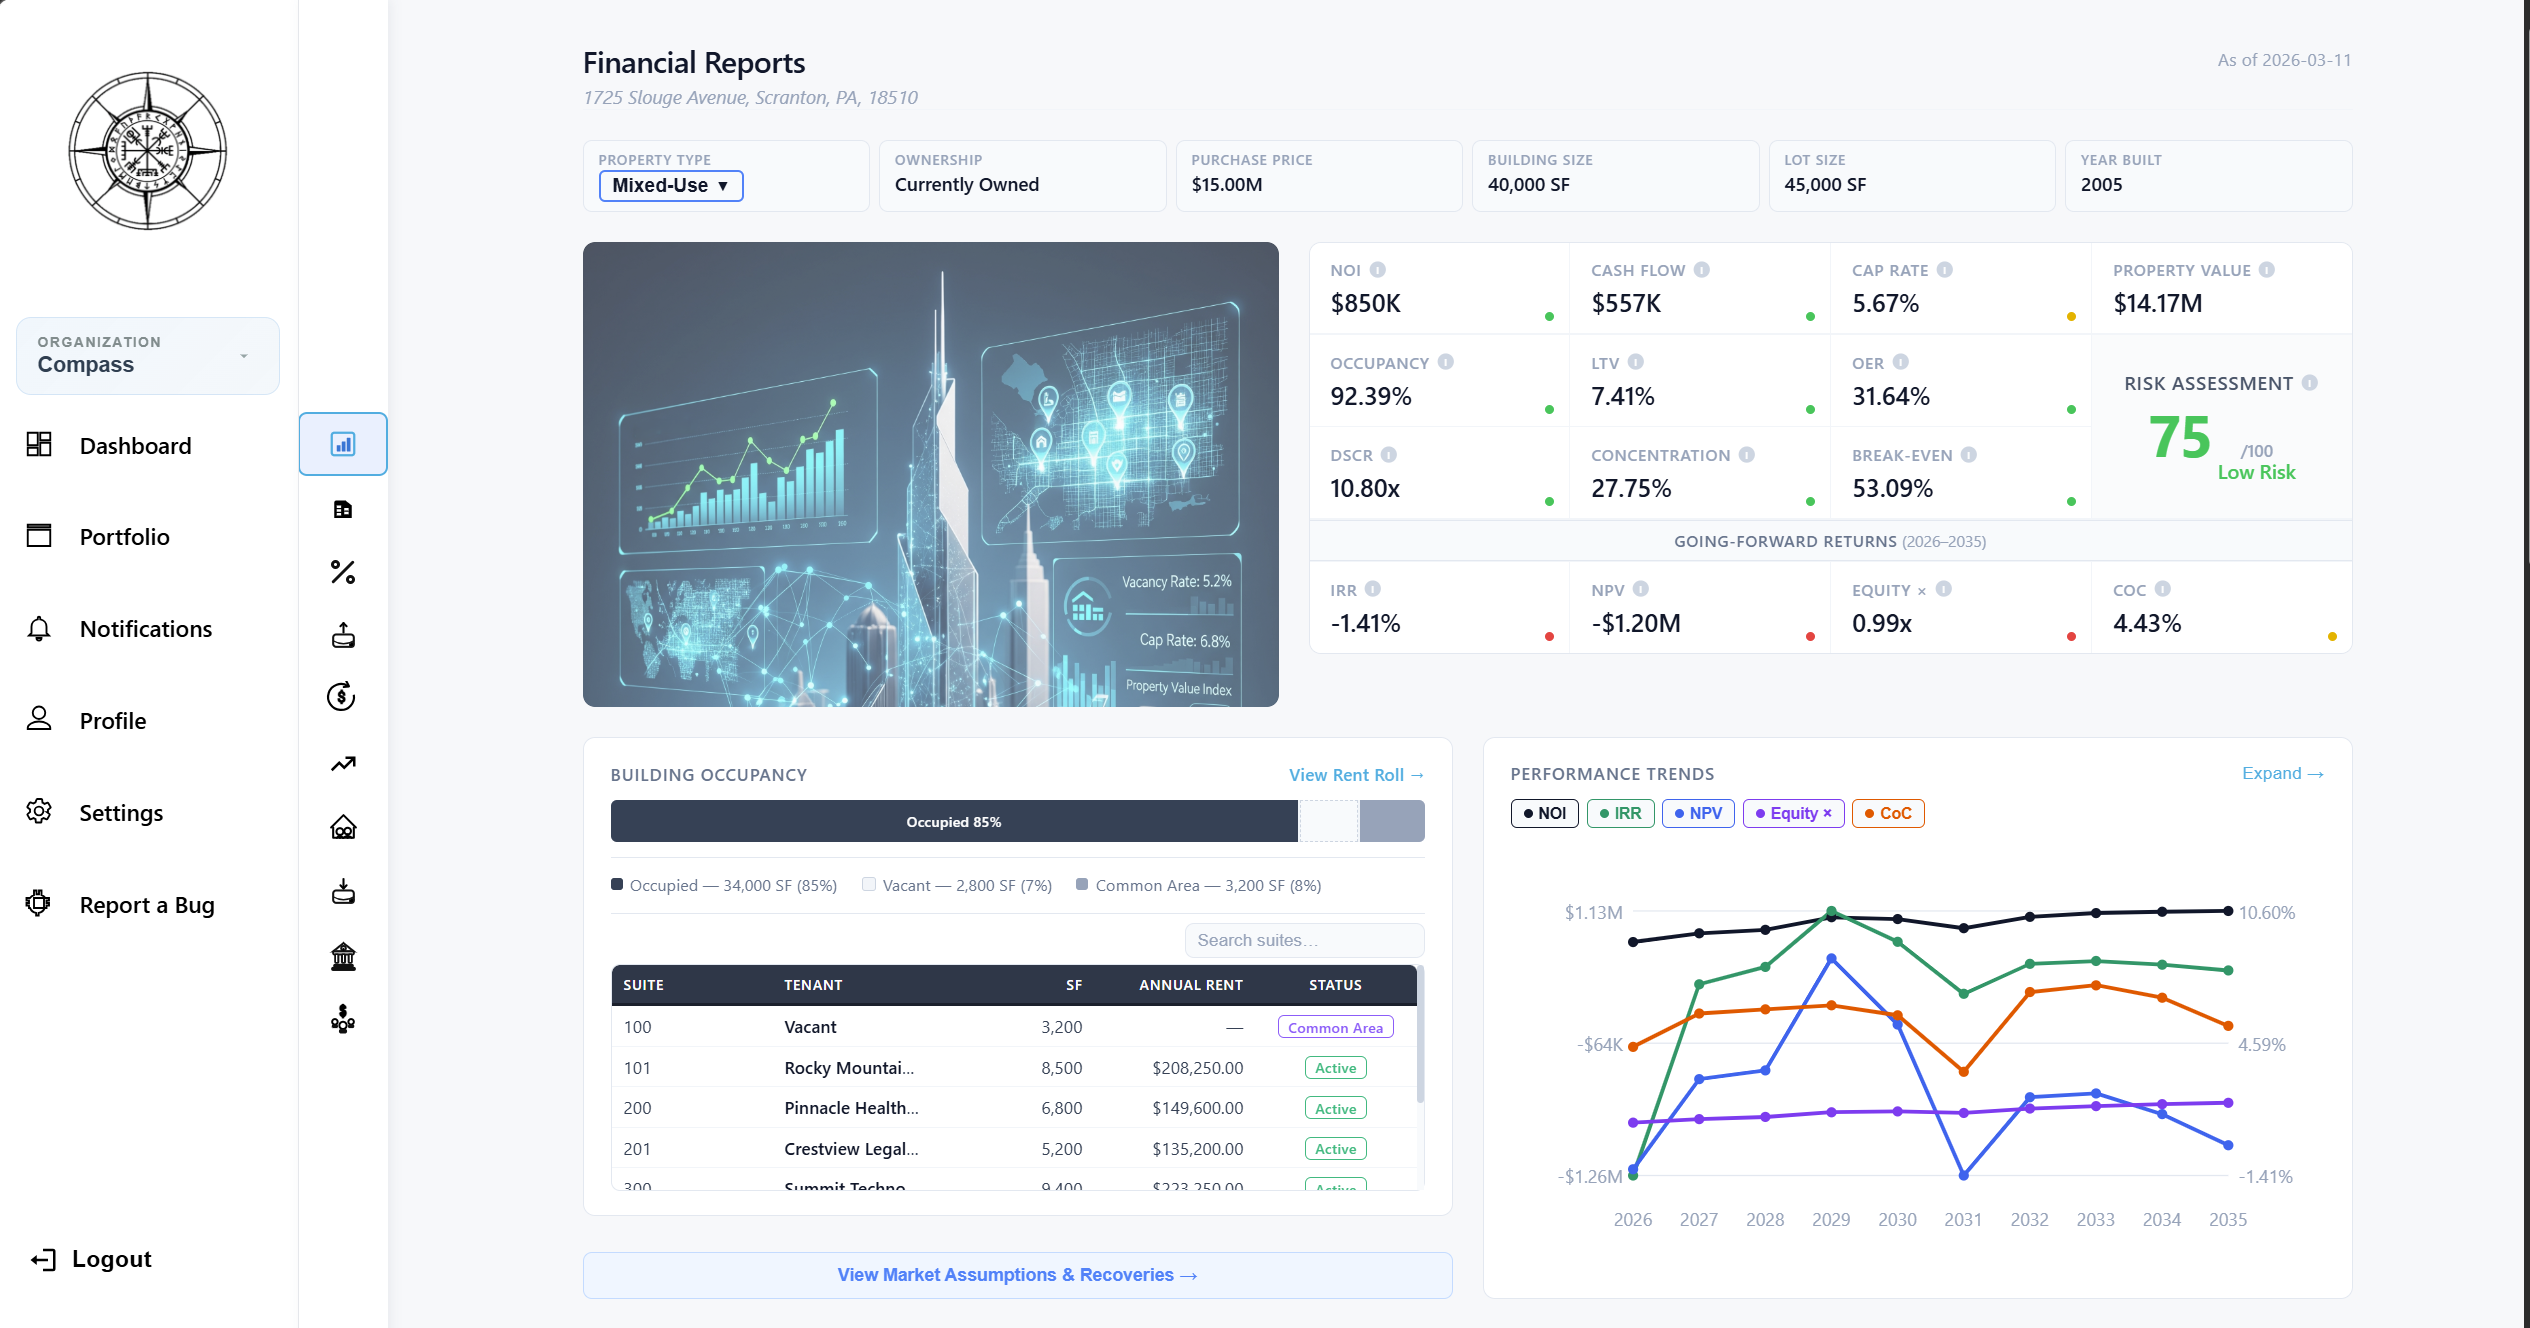
Property Overview
Geocoding, property types, ownership lifecycle, image uploads. Track properties from analysis through acquisition to sale.
Rates & Assumptions
Discount rate, cap rate, hold period, and custom year-by-year inflation arrays for market, expense, and general categories.
Operating Expenses
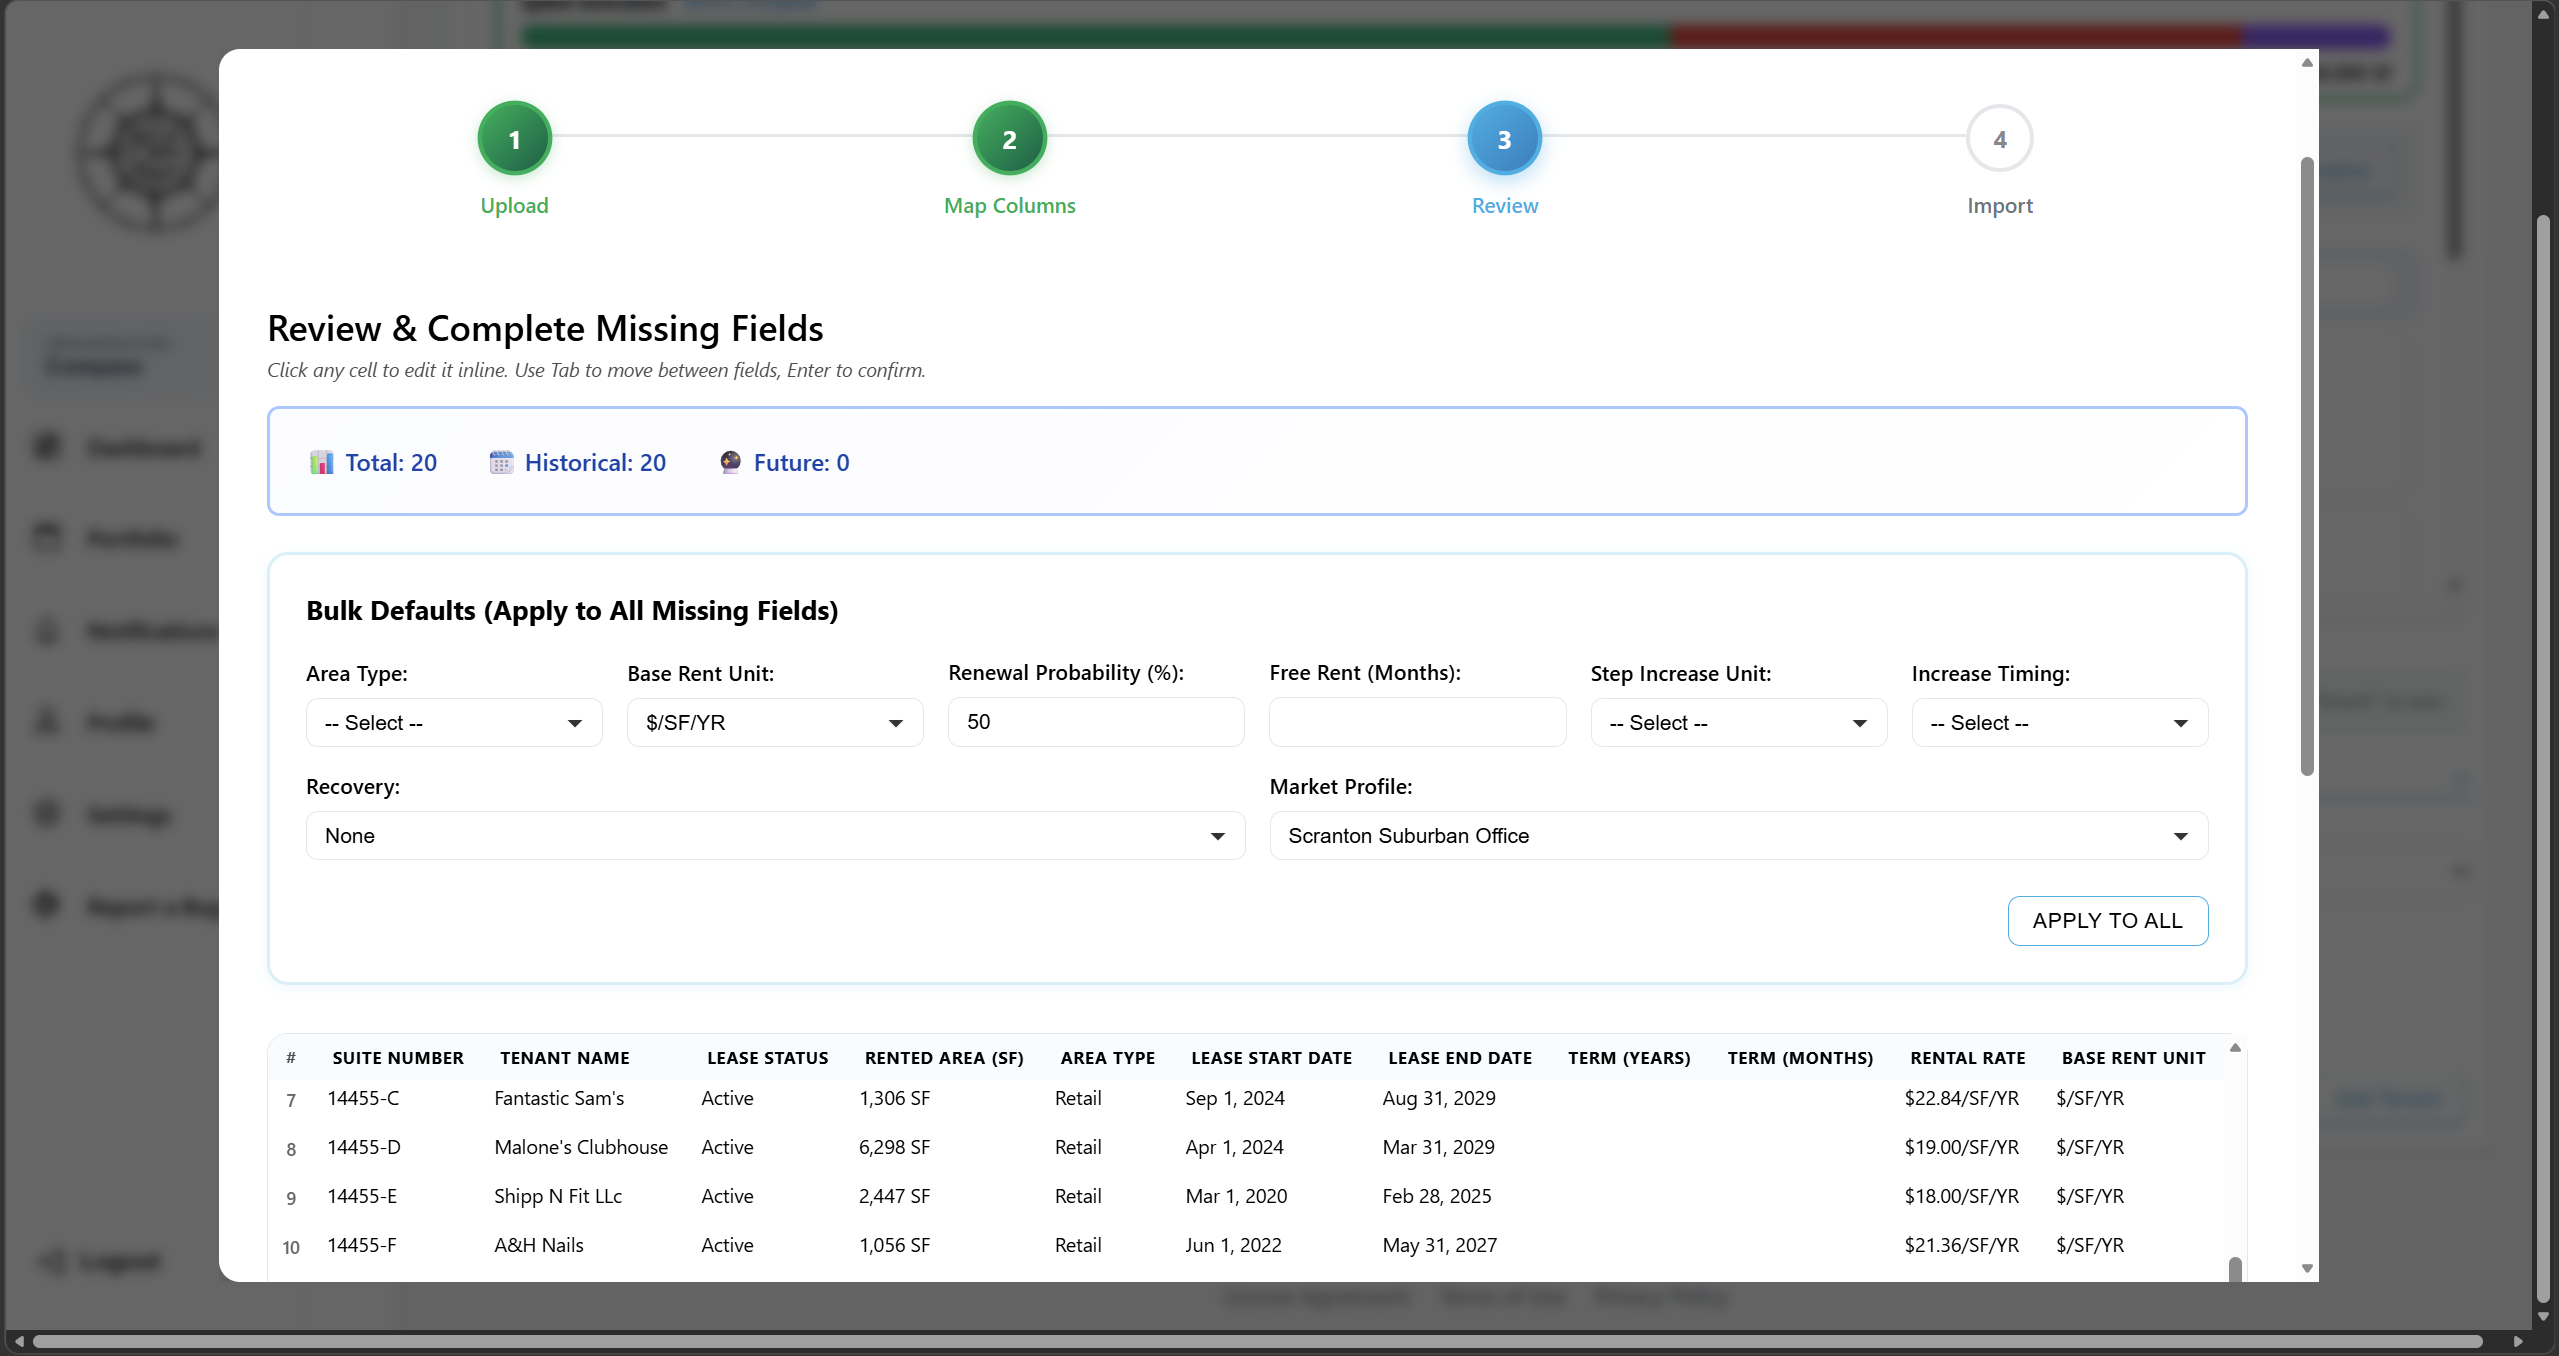
Unlimited expense categories with 10+ frequencies, percent fixed/variable splits, custom areas, and Excel bulk import from T-12.
Recoveries (NNN / Base Year / Mod Gross)
Automatic expense linking. Model net leases, base year stops, and modified gross recoveries — matching ARGUS-grade methodology.
Market Assumptions
Reusable market profiles with automatic inflation from last update date. Chain profiles to different property areas and suite types.
Tenant Lifecycle
13 accordion sections covering lease terms, step increases, renewal probability, holdover status, subleases, rent abatement, and security deposits.
Every Input. One Integrated Model.
Property details, expenses, tenants, market assumptions, and recoveries flow into a unified proforma engine — no copy-paste between spreadsheets.
Other Revenues
Track parking, signage, laundry, and miscellaneous income. ML-calibrated forecasting with period-average occupancy adjustments.
Financing & Debt
25+ loan fields, multiple loan types (fixed, floating, hybrid), construction loans, amortization schedules, prepayment penalties, DSCR covenants.
Investment & Waterfall
GP transaction fees, 4-tier institutional waterfall preferences, inline investor editing, capital reserve management and forecasting.
From Income to IRR.
In Seconds.
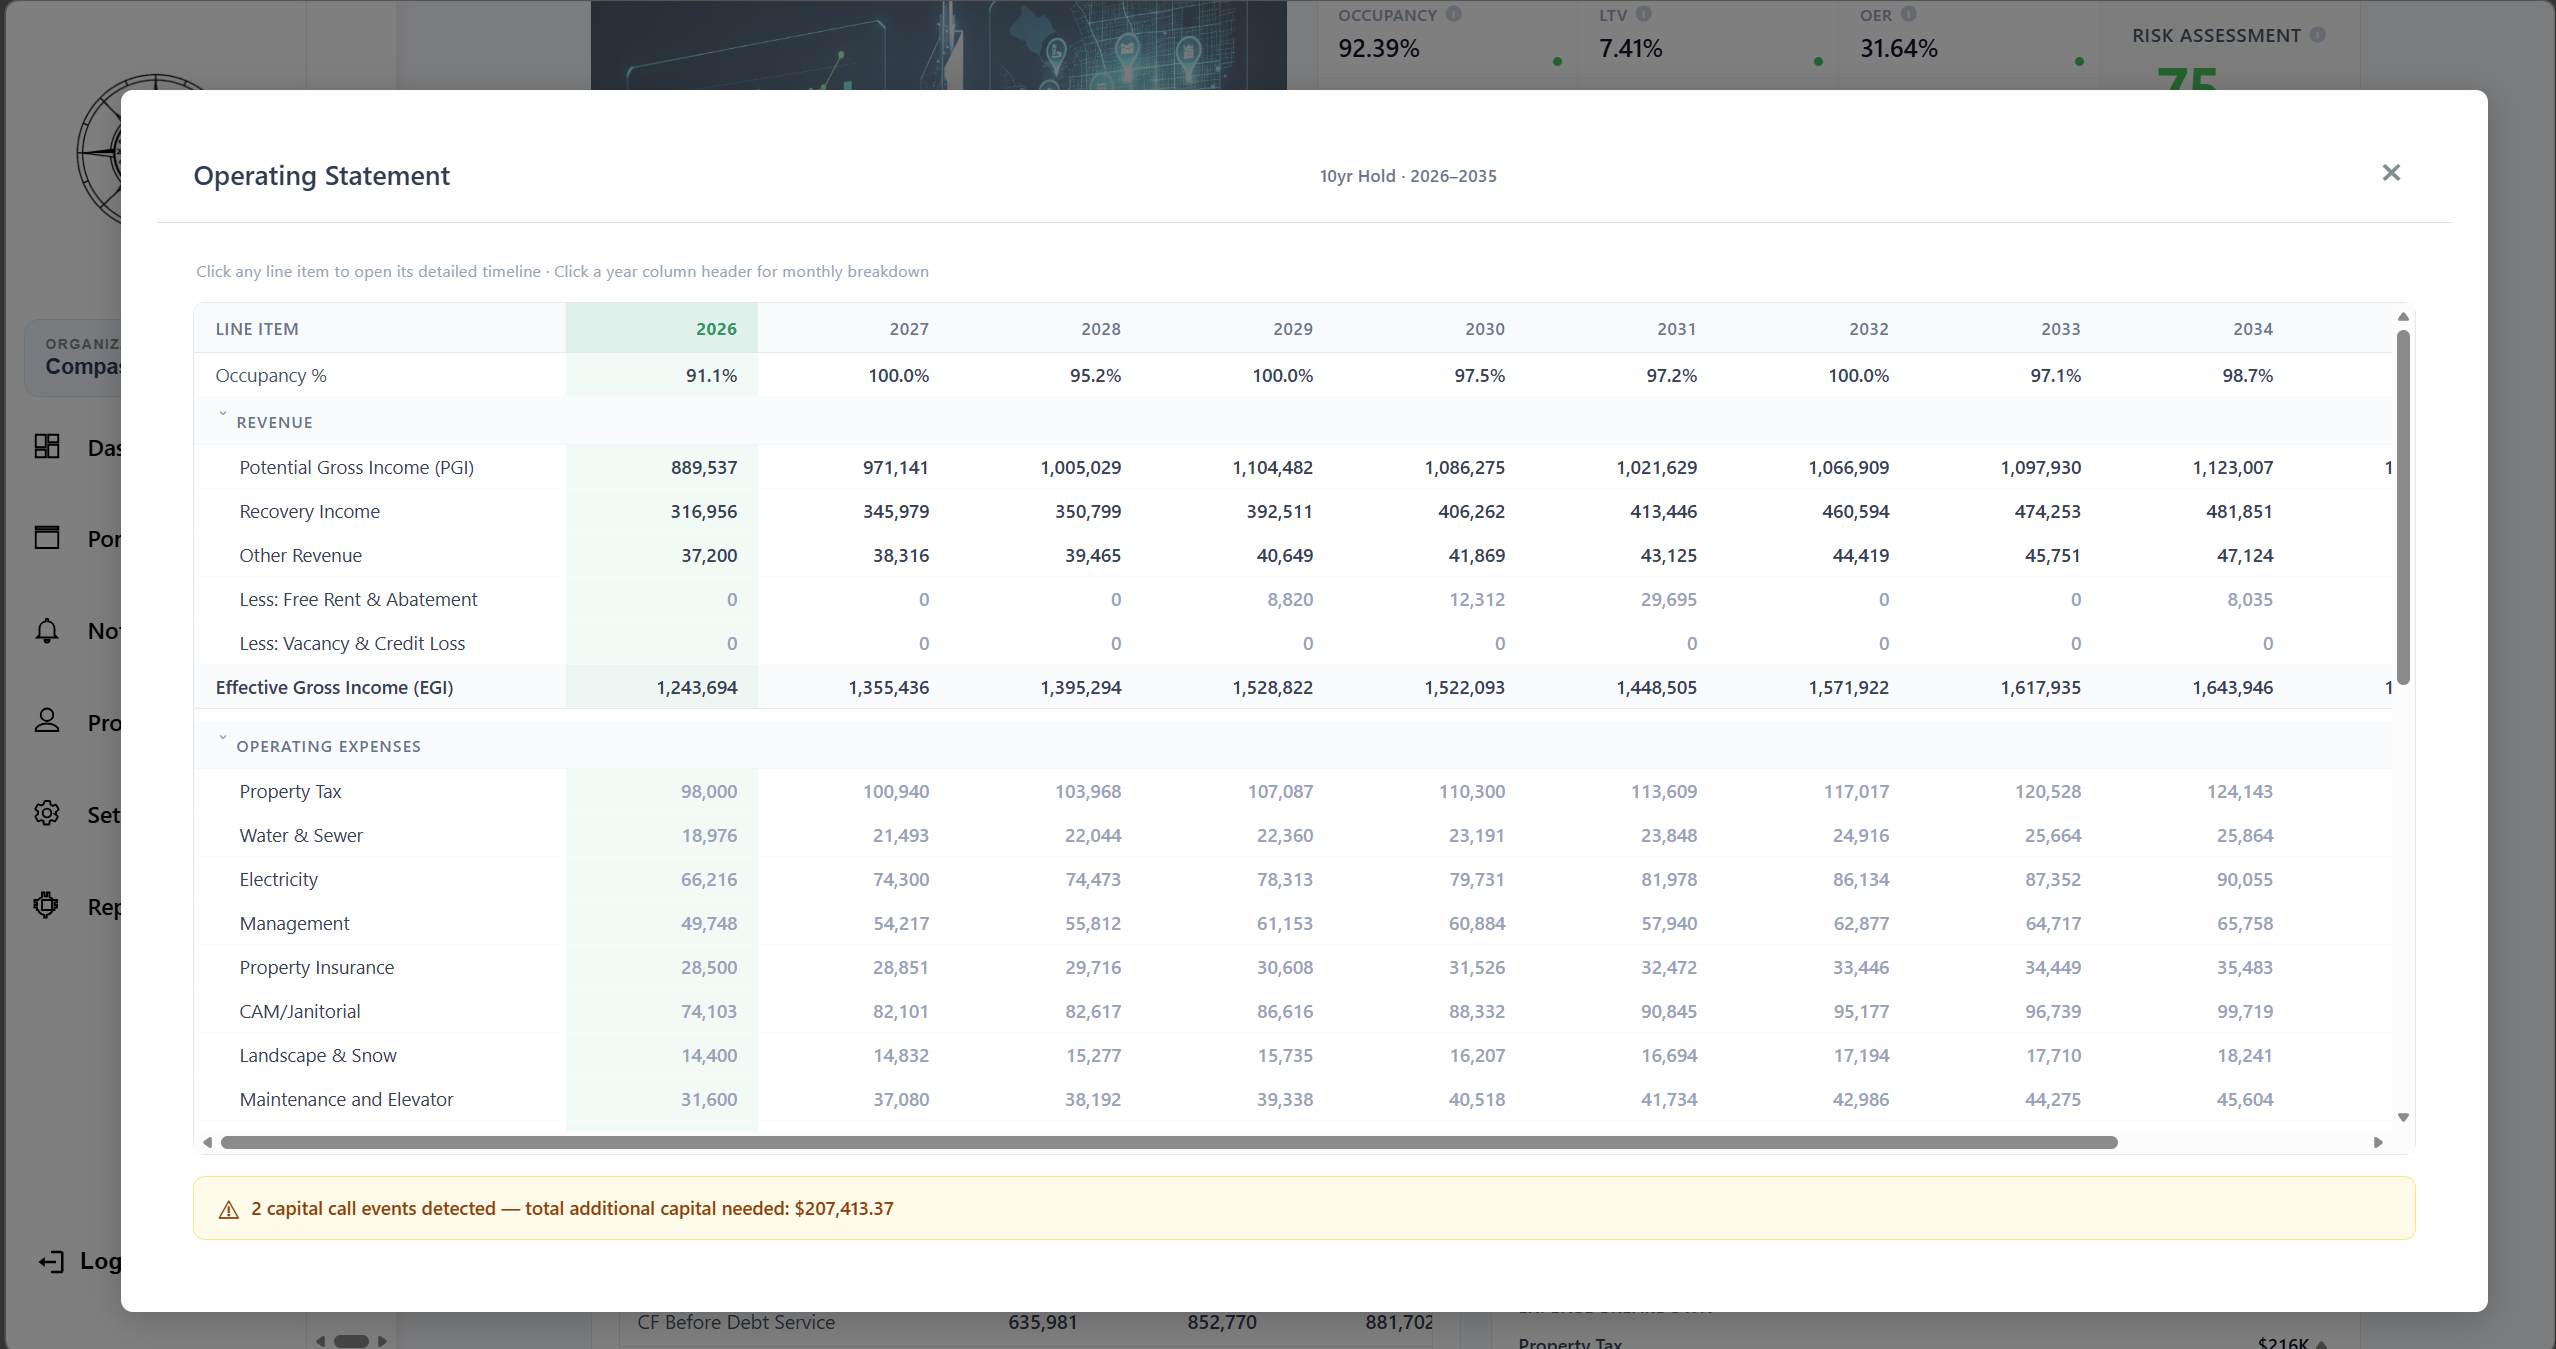
Compass generates complete operating statements with annual and monthly views. Drill into any line item, see exit scenarios for every year, and compare going-forward vs. since-acquisition returns.
ML-Powered Forecasting
Compass learns from your actual payment history. Observed escalation rates blend with your assumptions based on confidence level — improving every quarter.
Fluid Timeline Engine
Calculations auto-adjust as time passes. Vacancies extend, leases expire, and projections update — without you touching anything.
15-Factor Risk Scoring
WALT, tenant concentration, debt maturity, break-even occupancy, DSCR, LTV, vacancy rate, and more — weighted and scored automatically.
Your Data Gets Smarter
Over Time.
As you enter actual payments, Compass observes real escalation rates and blends them with your assumptions — giving you forecasts grounded in reality, not just theory.
Operating Statement
Annual and monthly views. PGI, vacancy, EGI, expenses, NOI, debt service, and cash flow — with drill-down modals for every line item.
Exit Scenario Analysis
See IRR, NPV, and equity multiples for every possible exit year. Optimal exit year highlighted. Loan maturity flags and historical year separators.
Organizations & Sharing
Create teams with owner/admin/member/viewer roles. Share properties across organizations with granular per-page visibility controls.
Complete Audit Trail
Every change across all 9 entity types is recorded in a searchable activity log. Manual notes, automated tracking, and date-filtered history.
See Compass in Action
Real screenshots from the Compass platform — not mockups.
KPI Dashboard & Risk Assessment
Annual Operating Statement
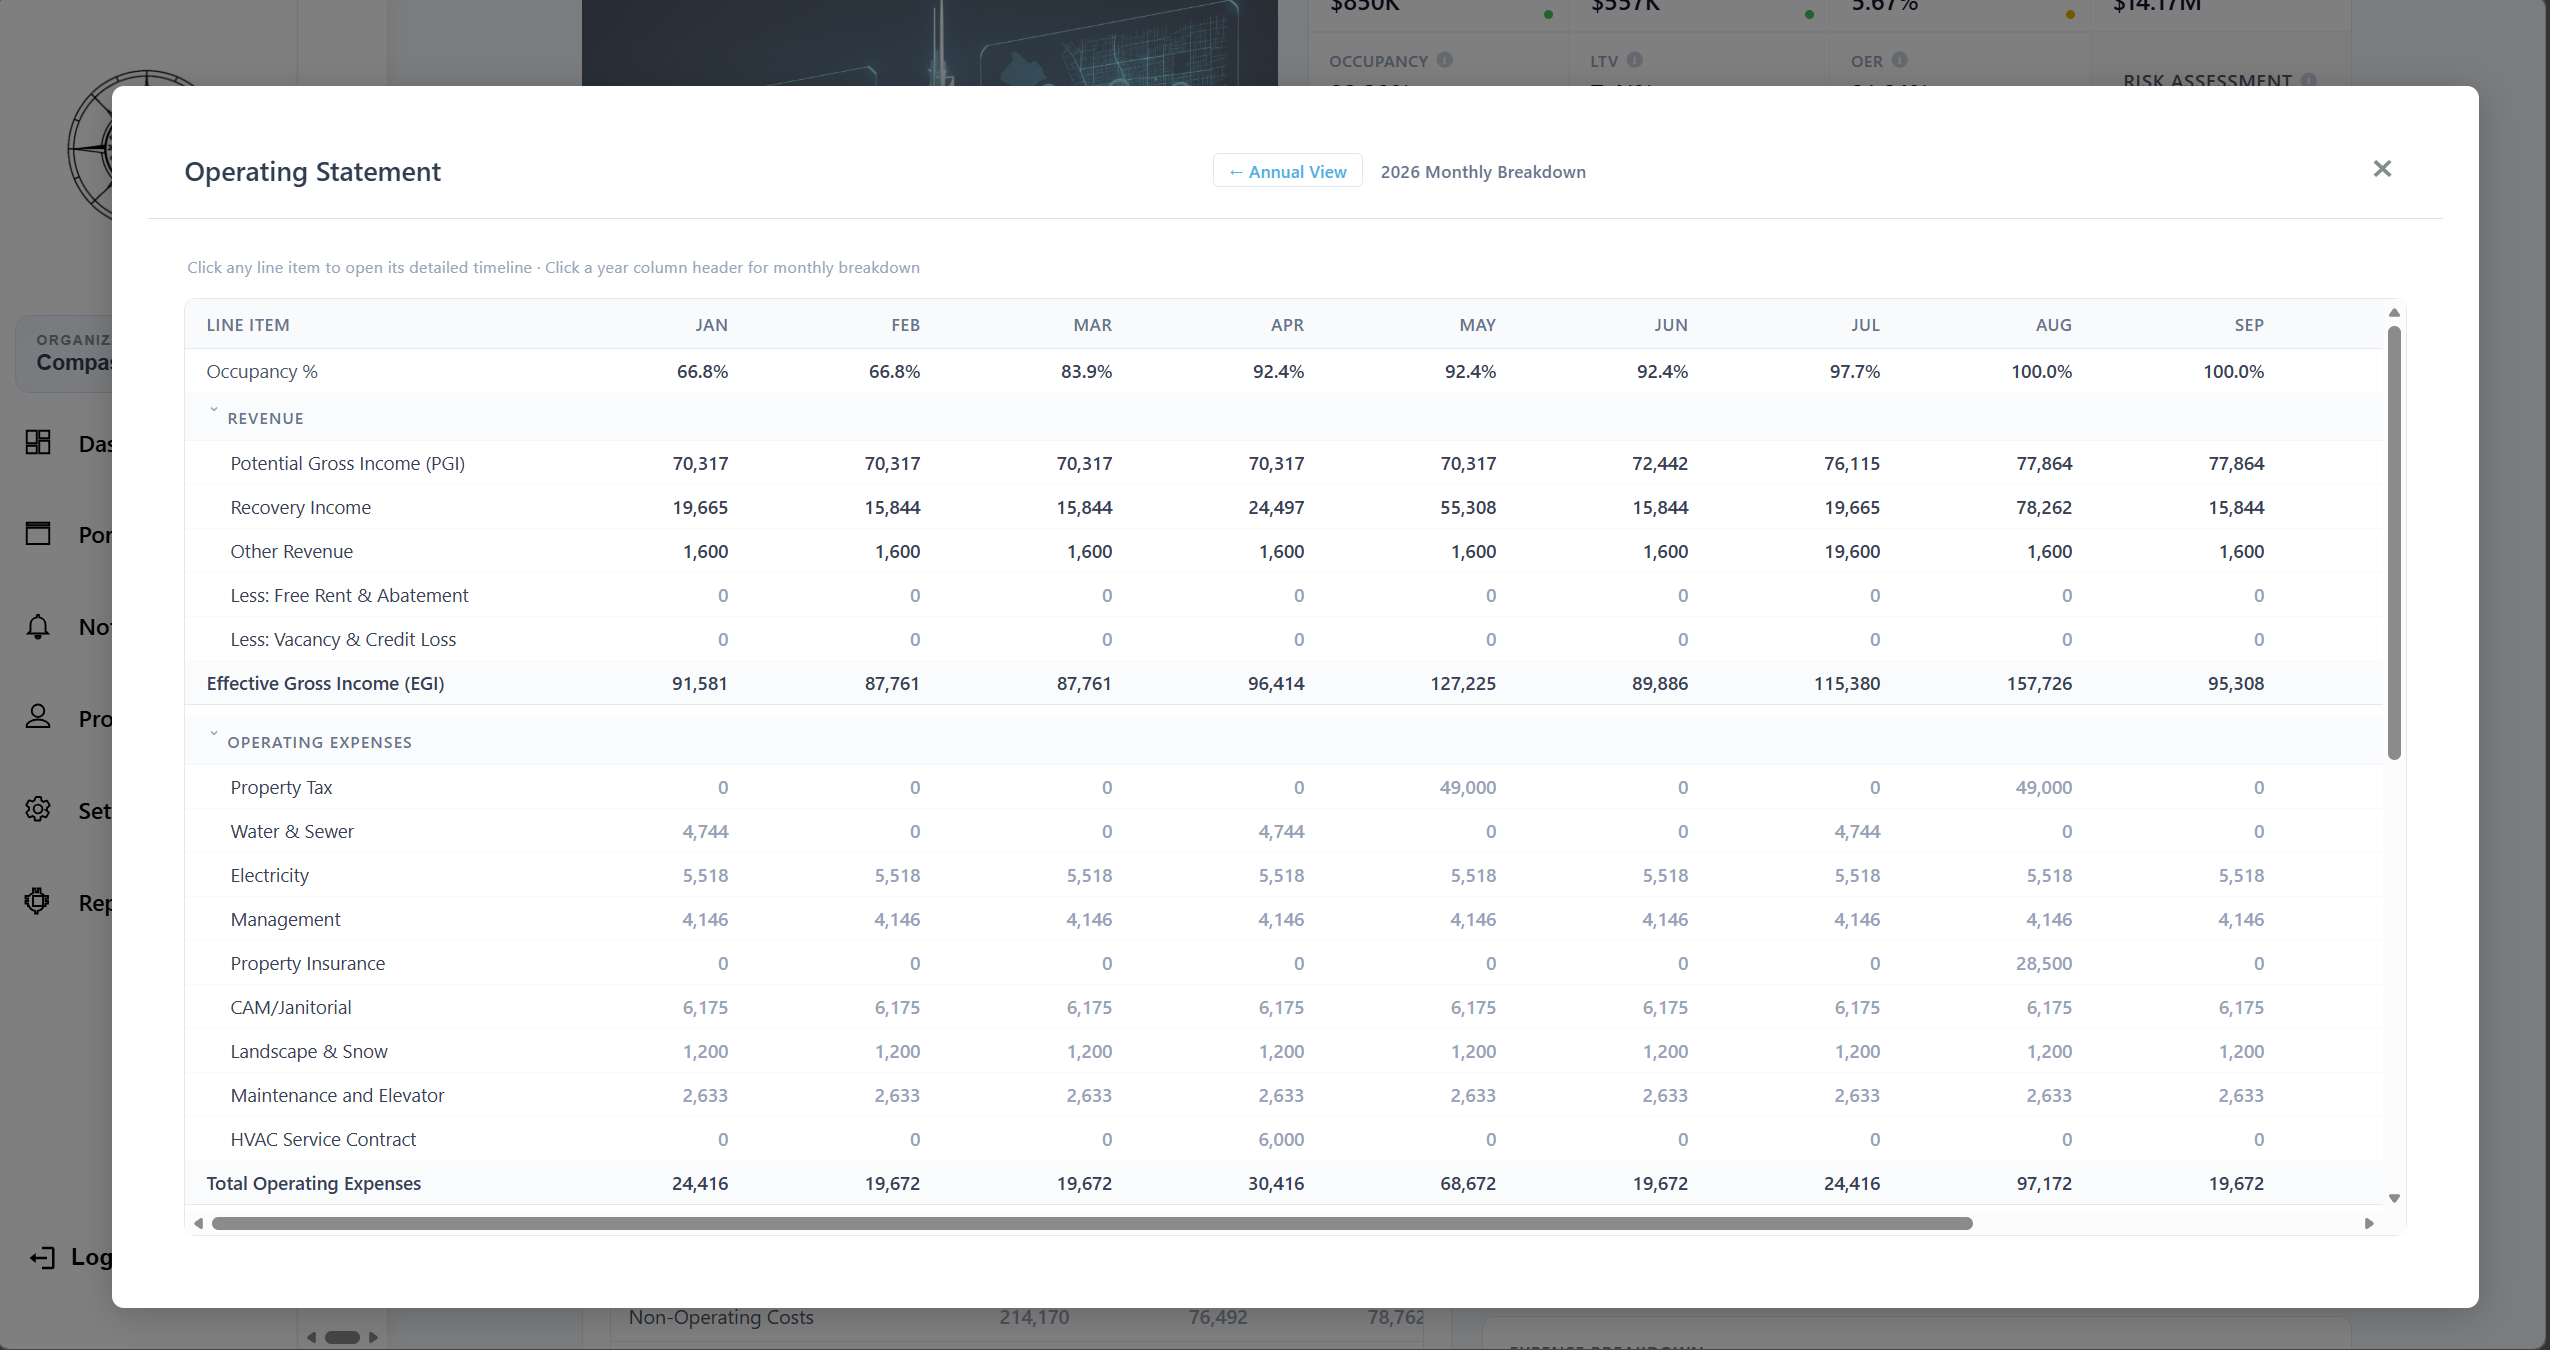
Monthly Operating Statement
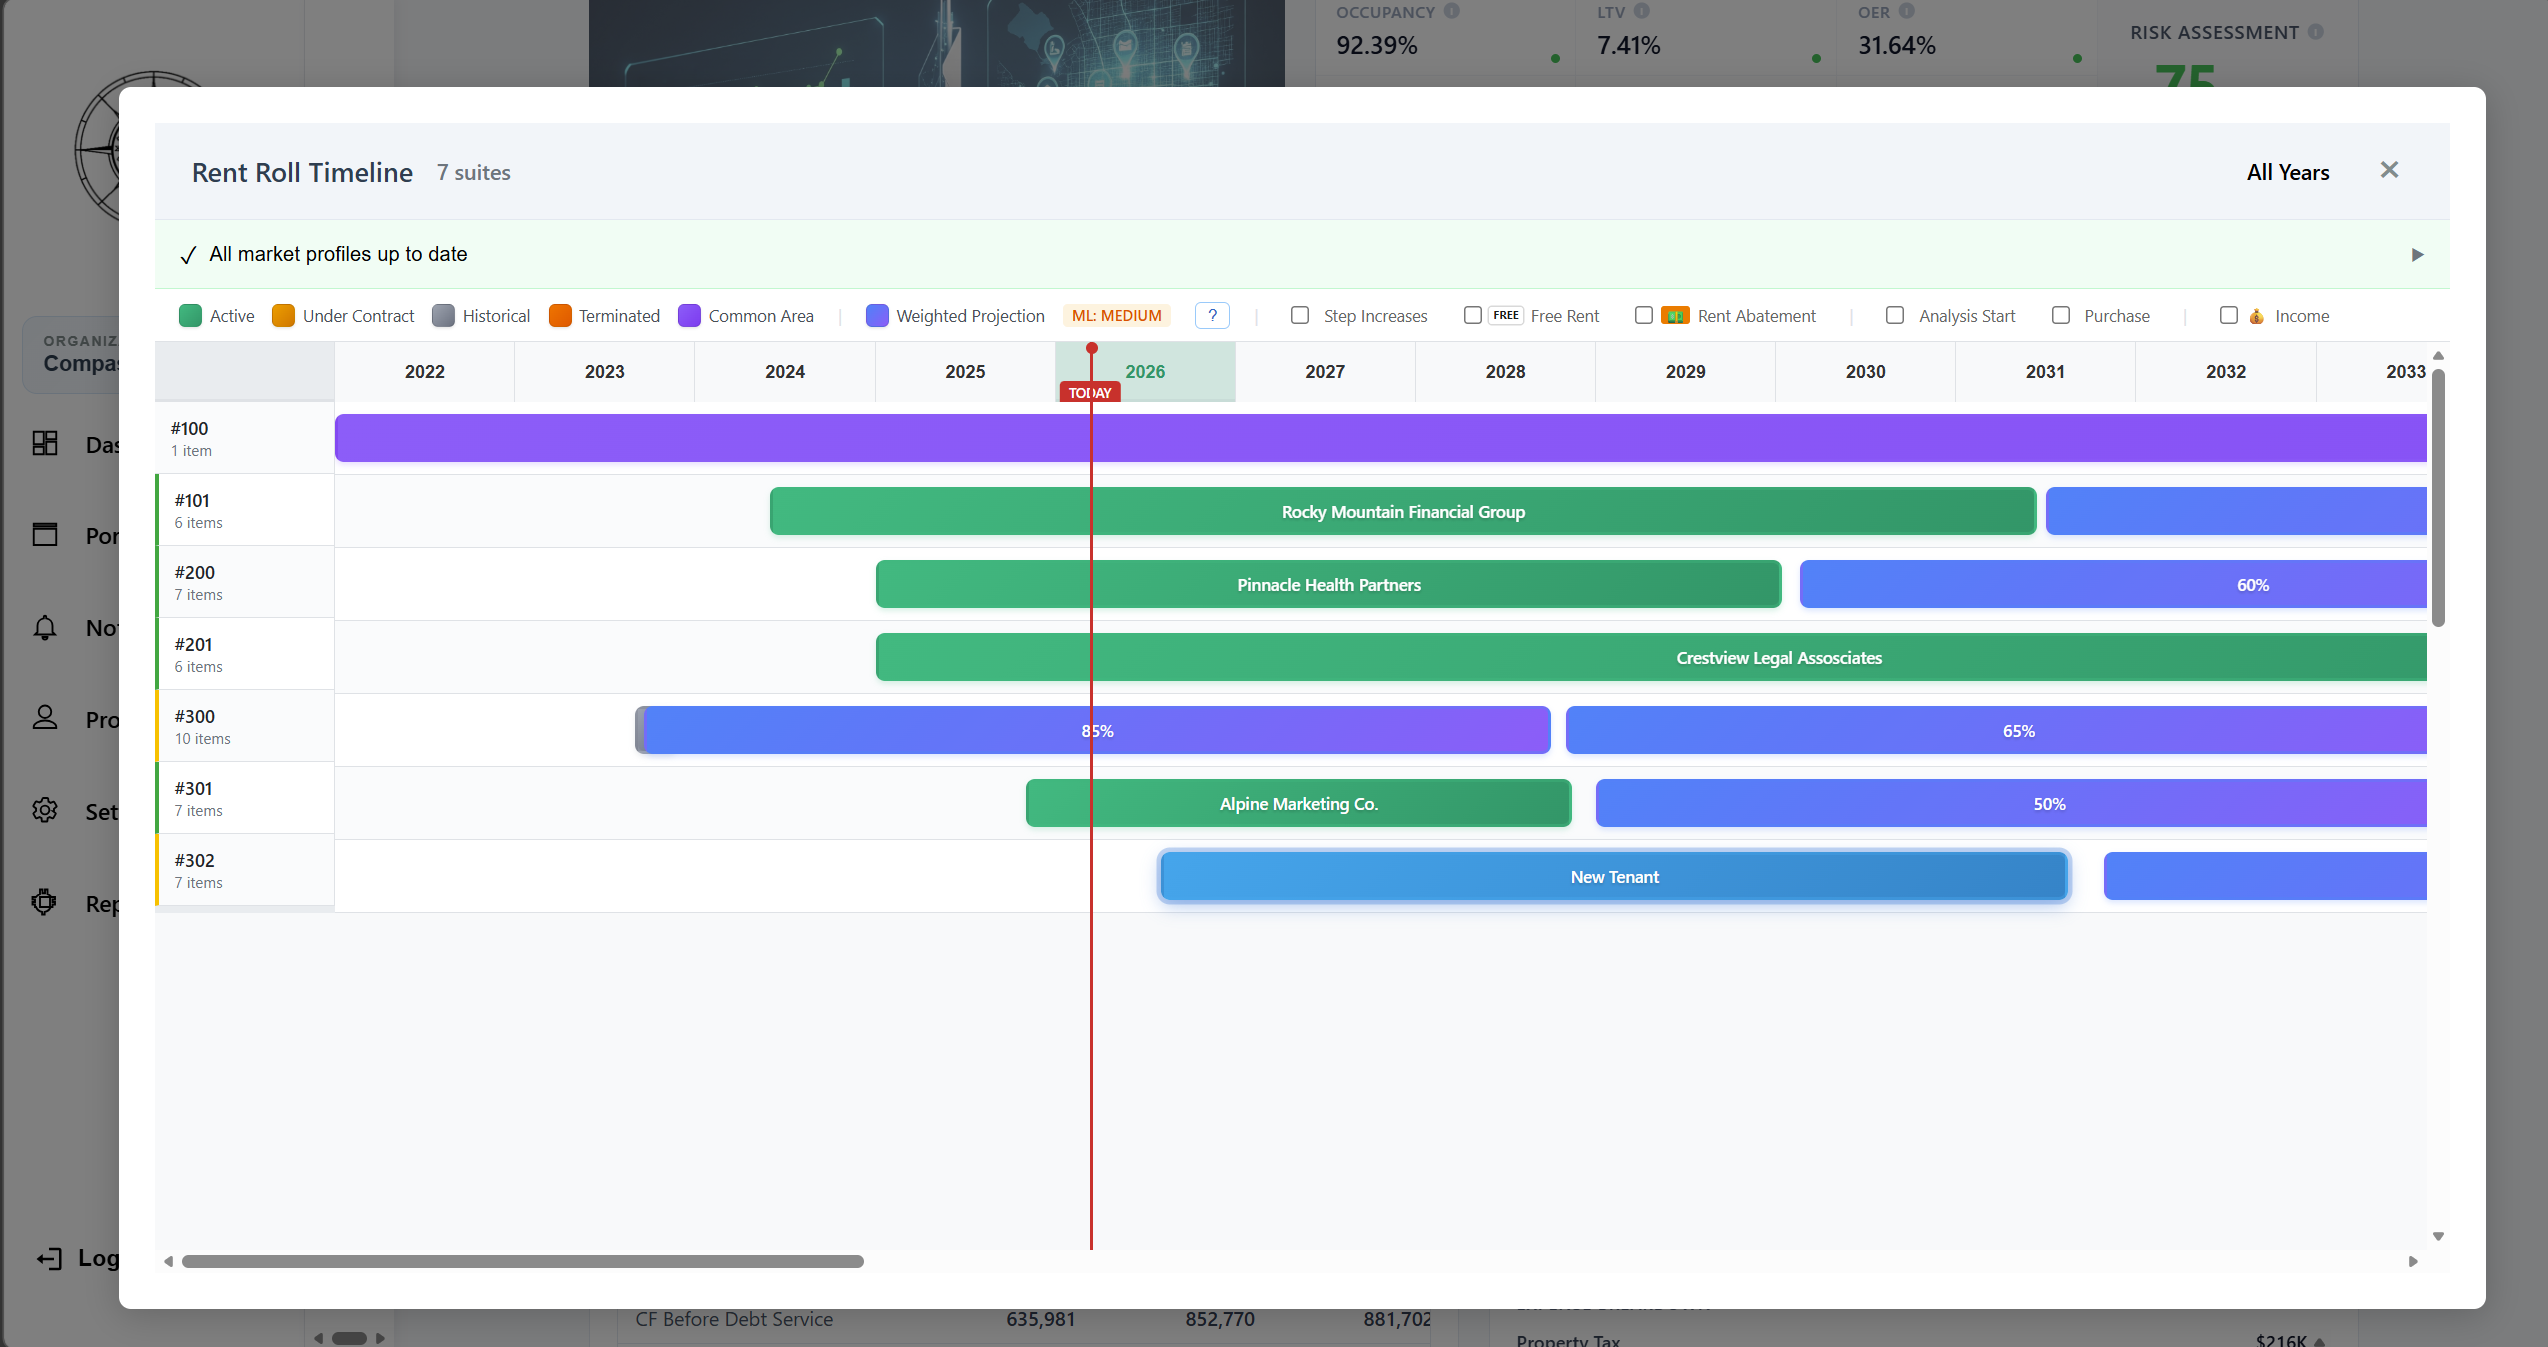
Rent Roll Timeline
Excel Import Wizard
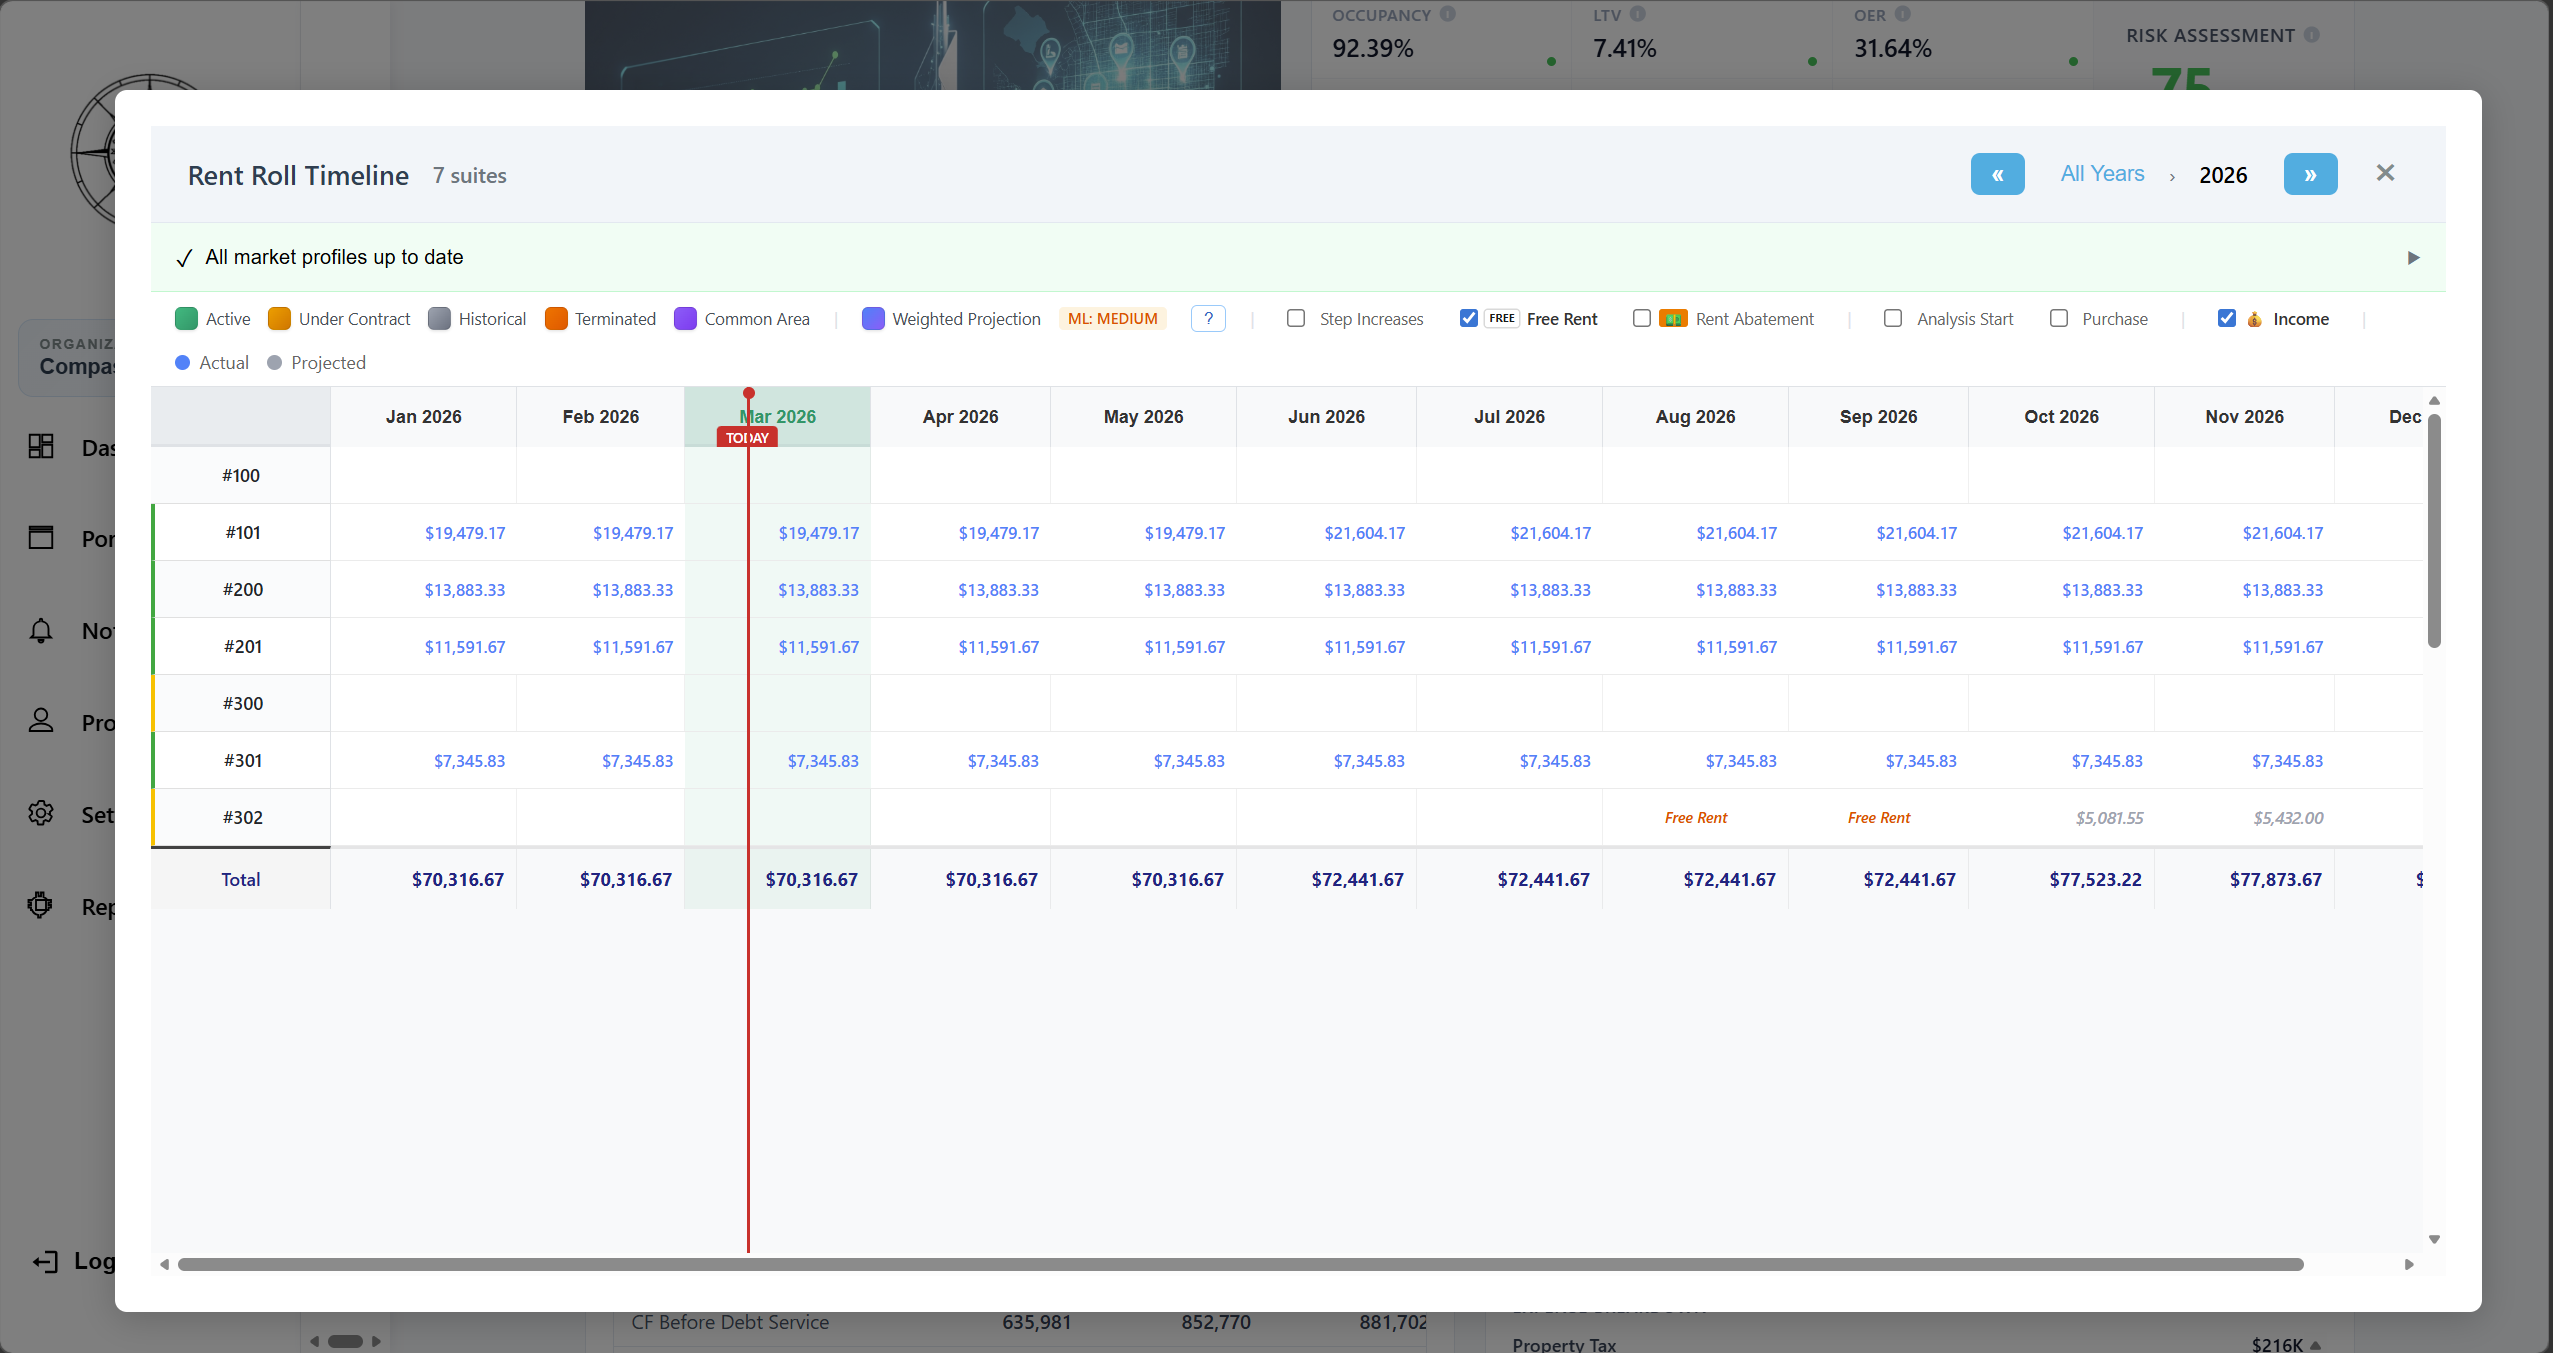
Income Rent Roll Timeline
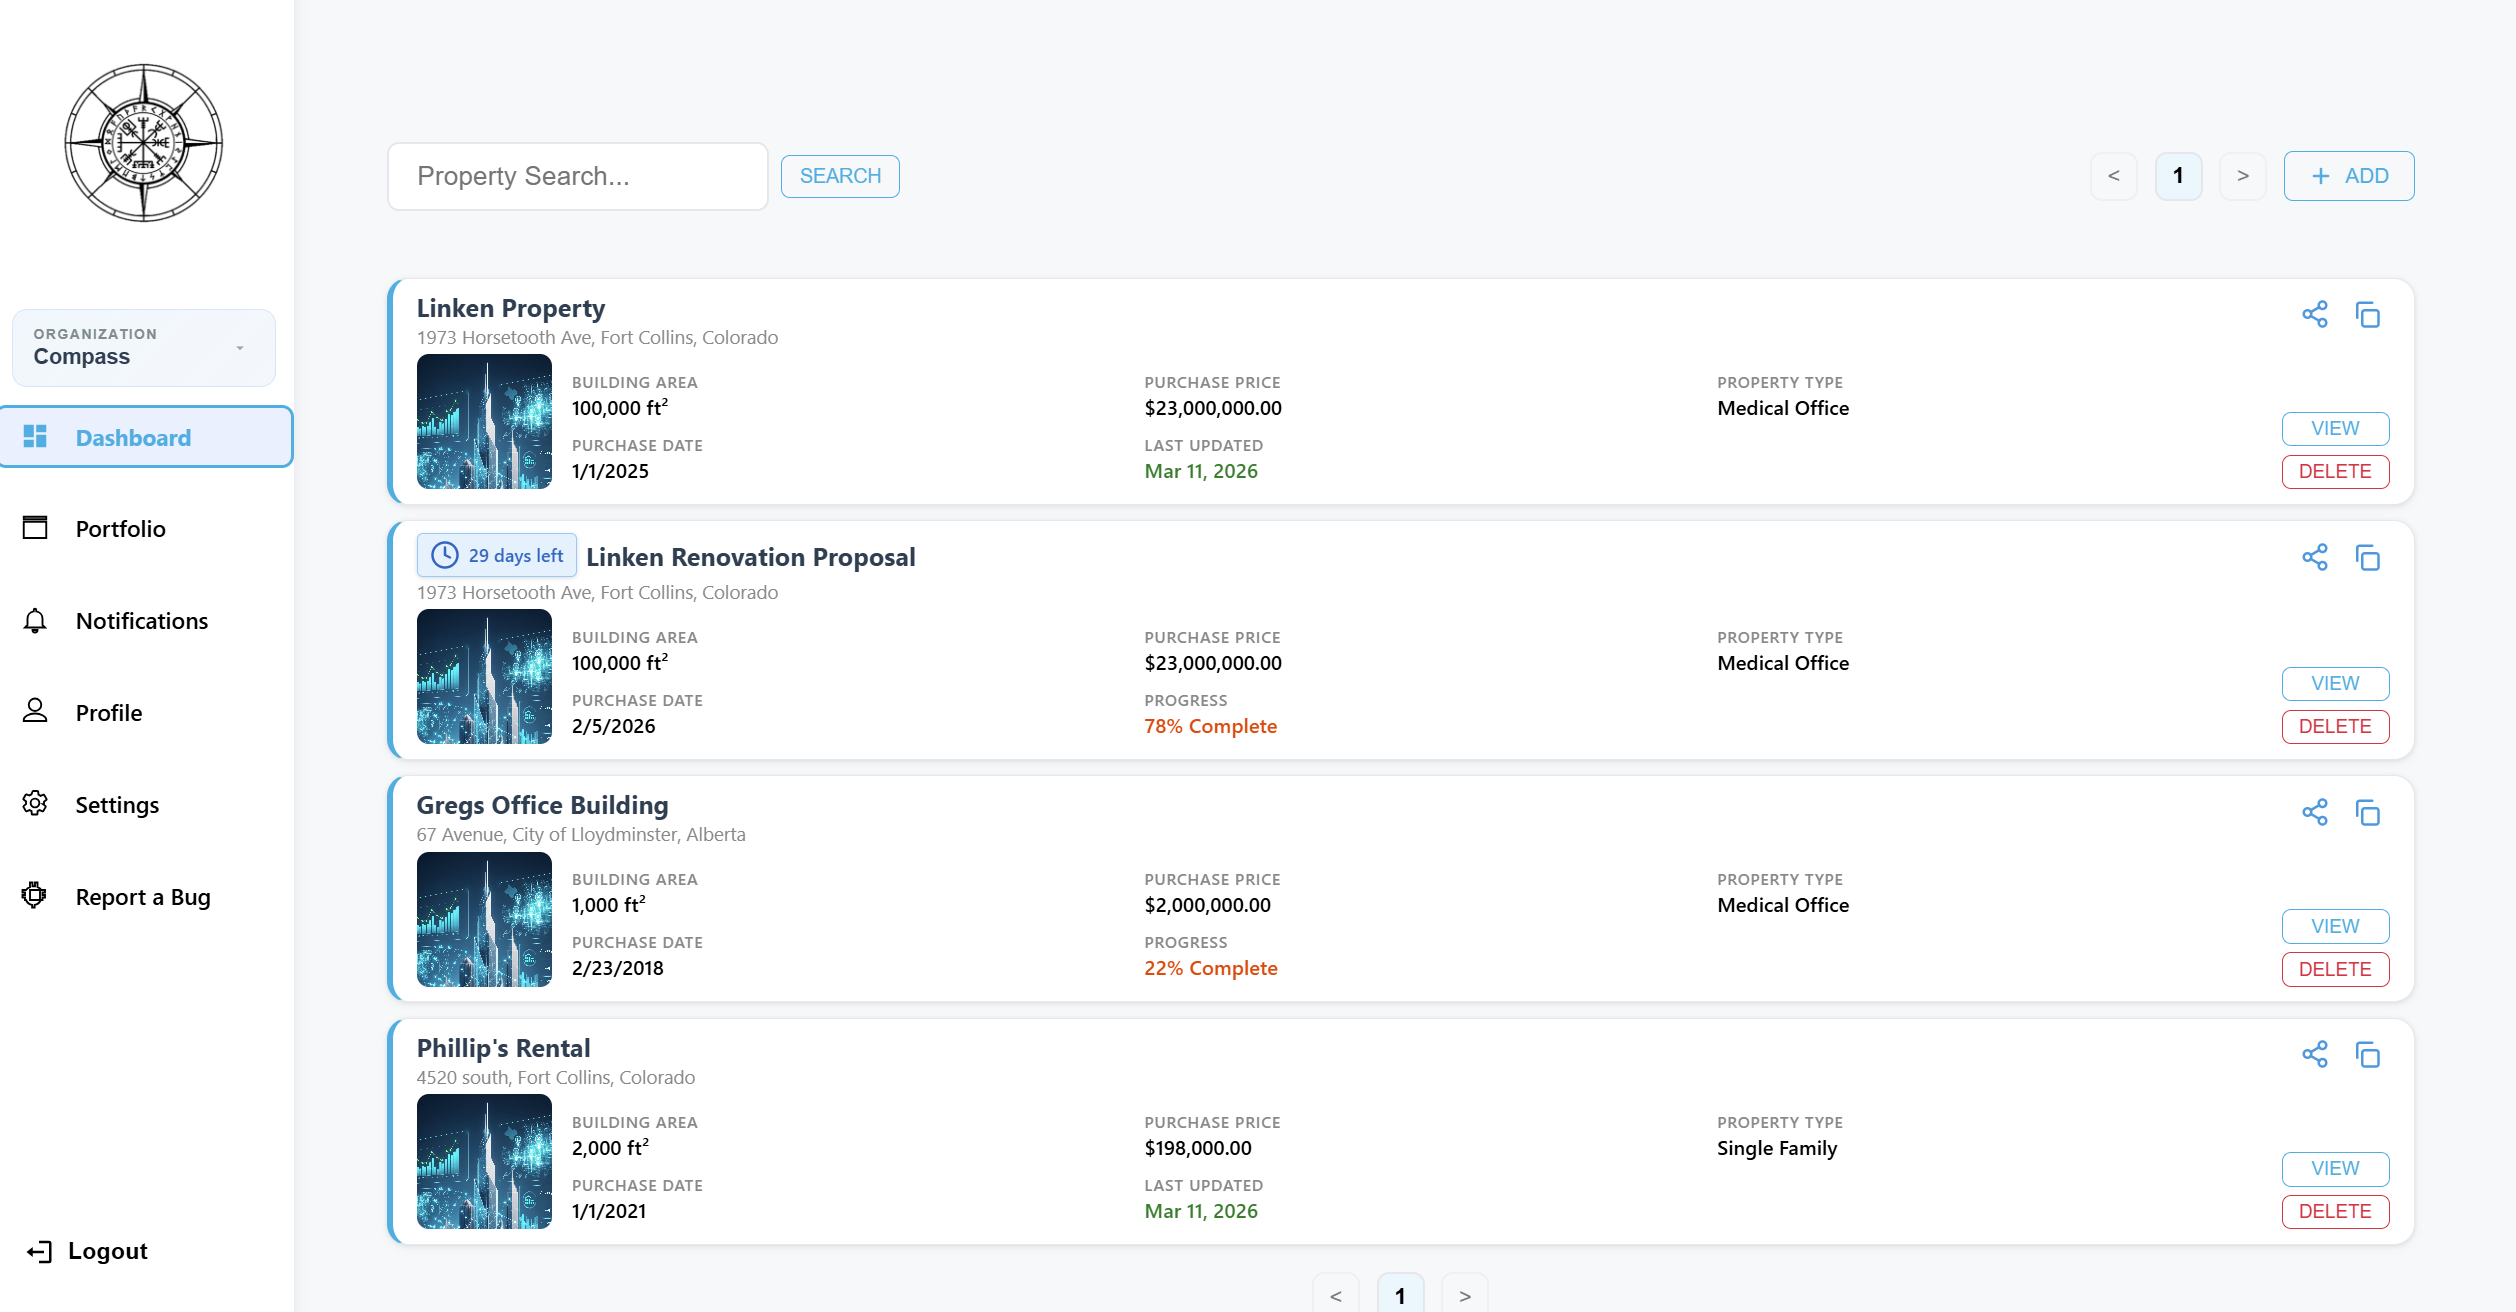
Property Dashboard
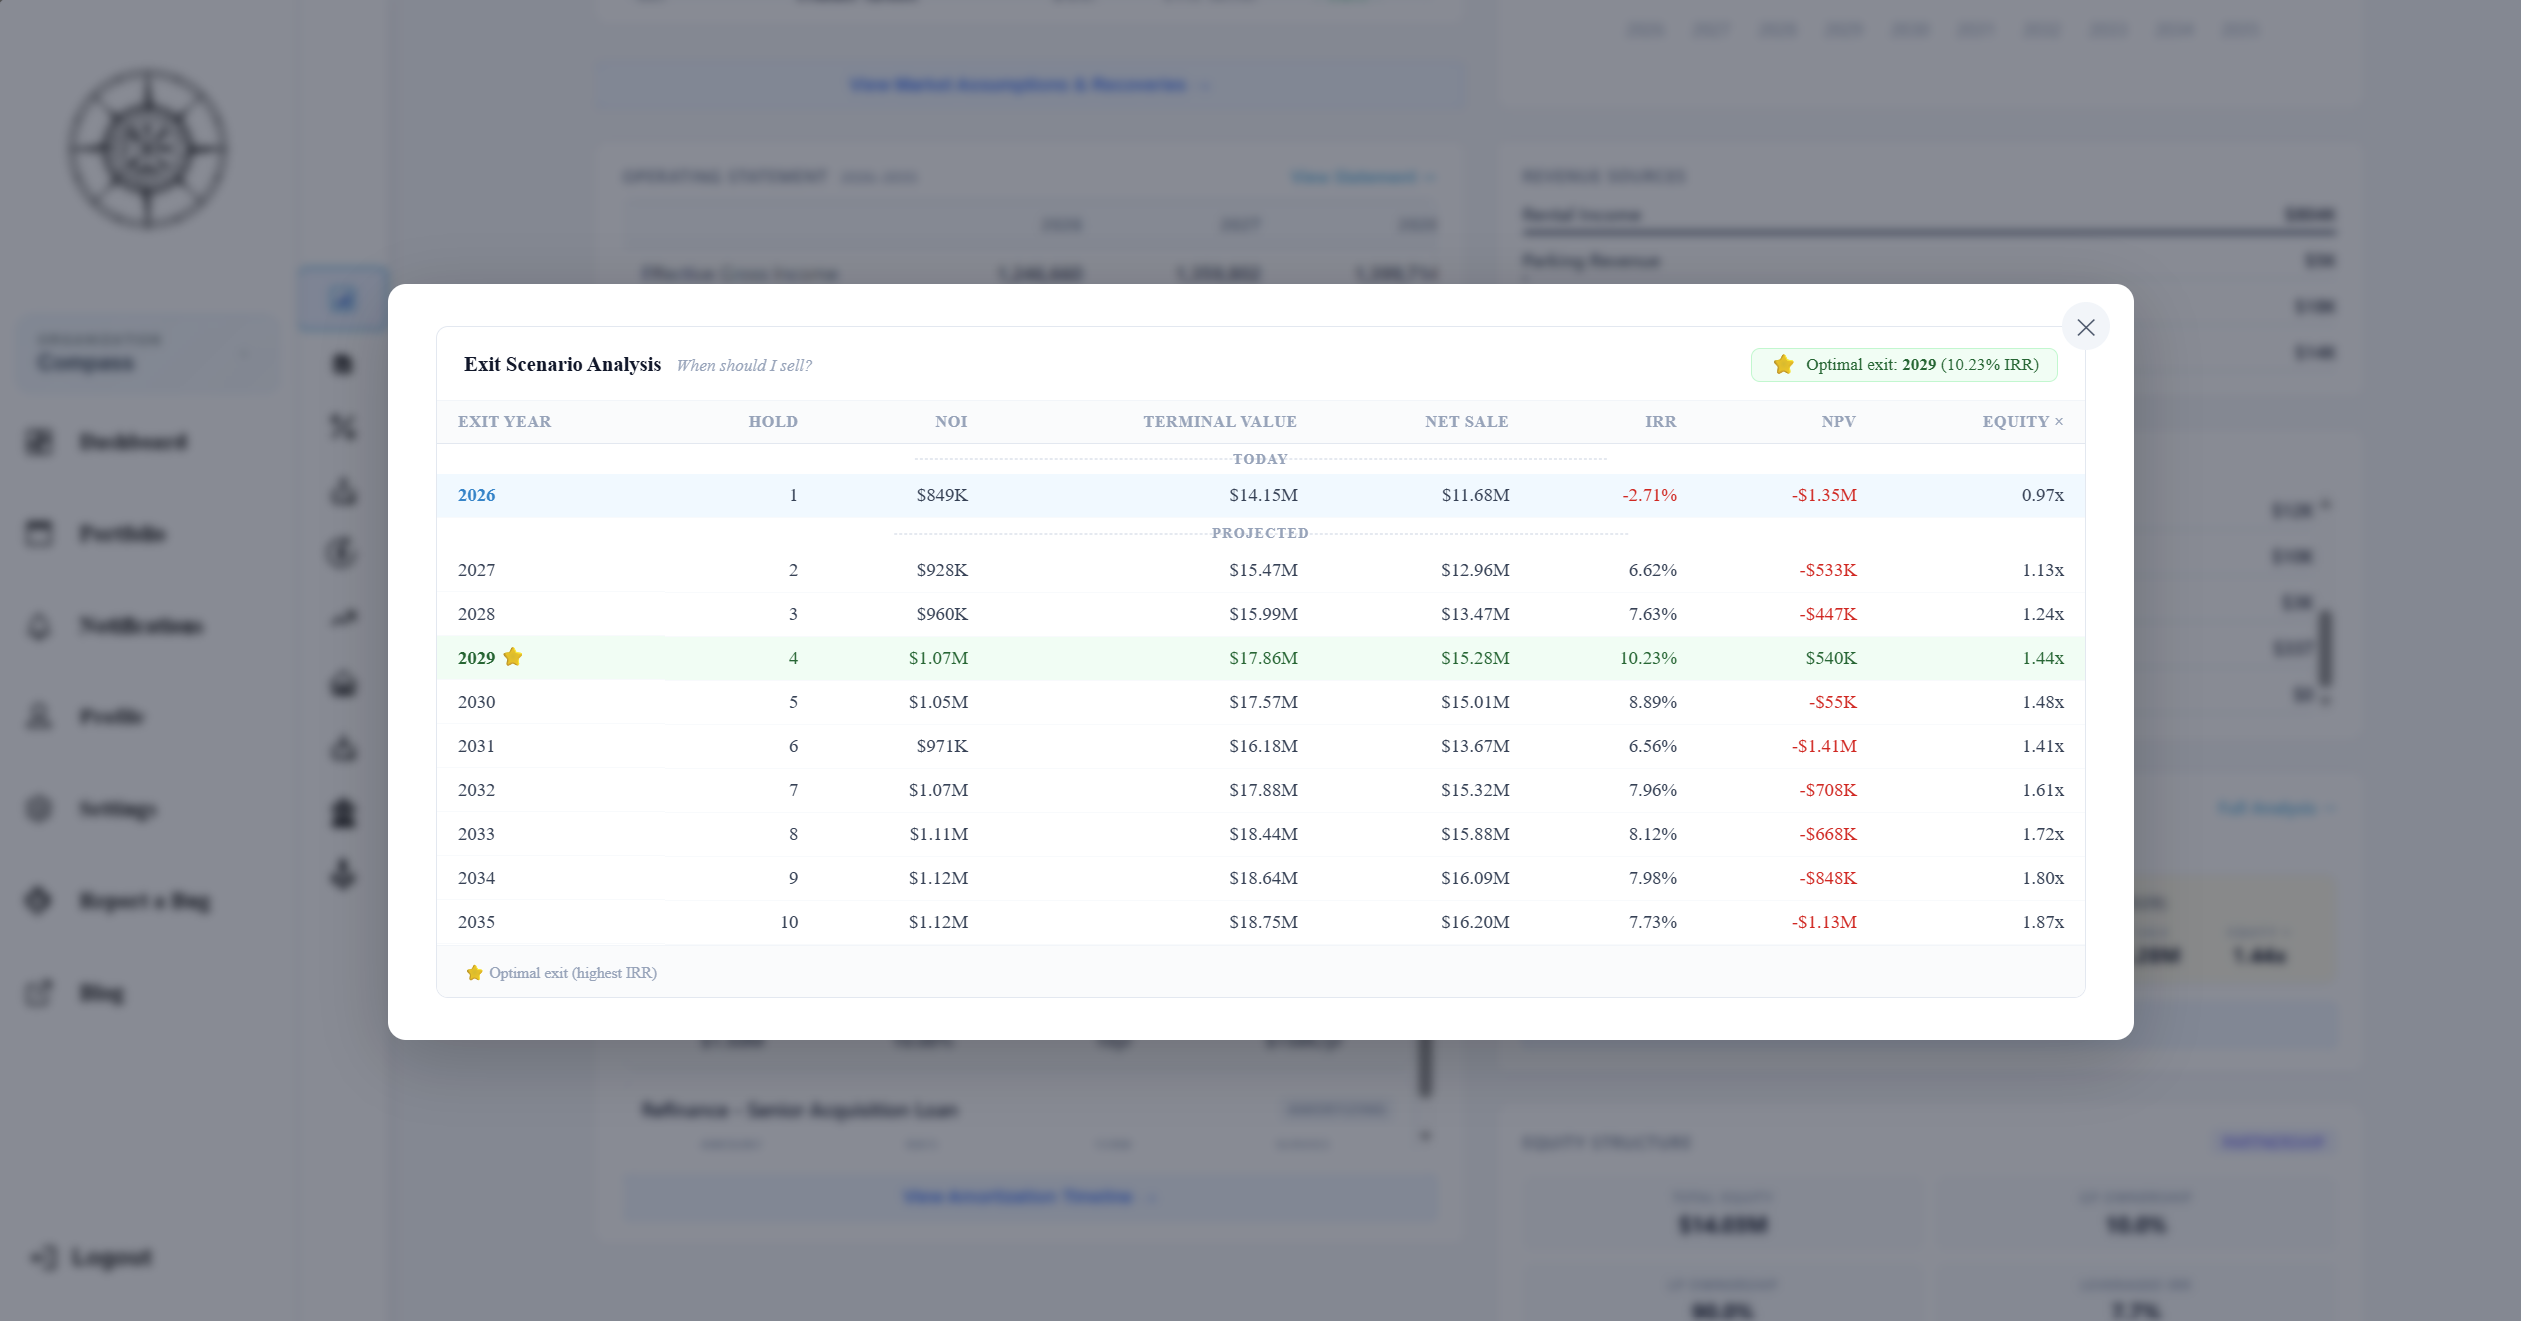
Exit Scenario Analysis
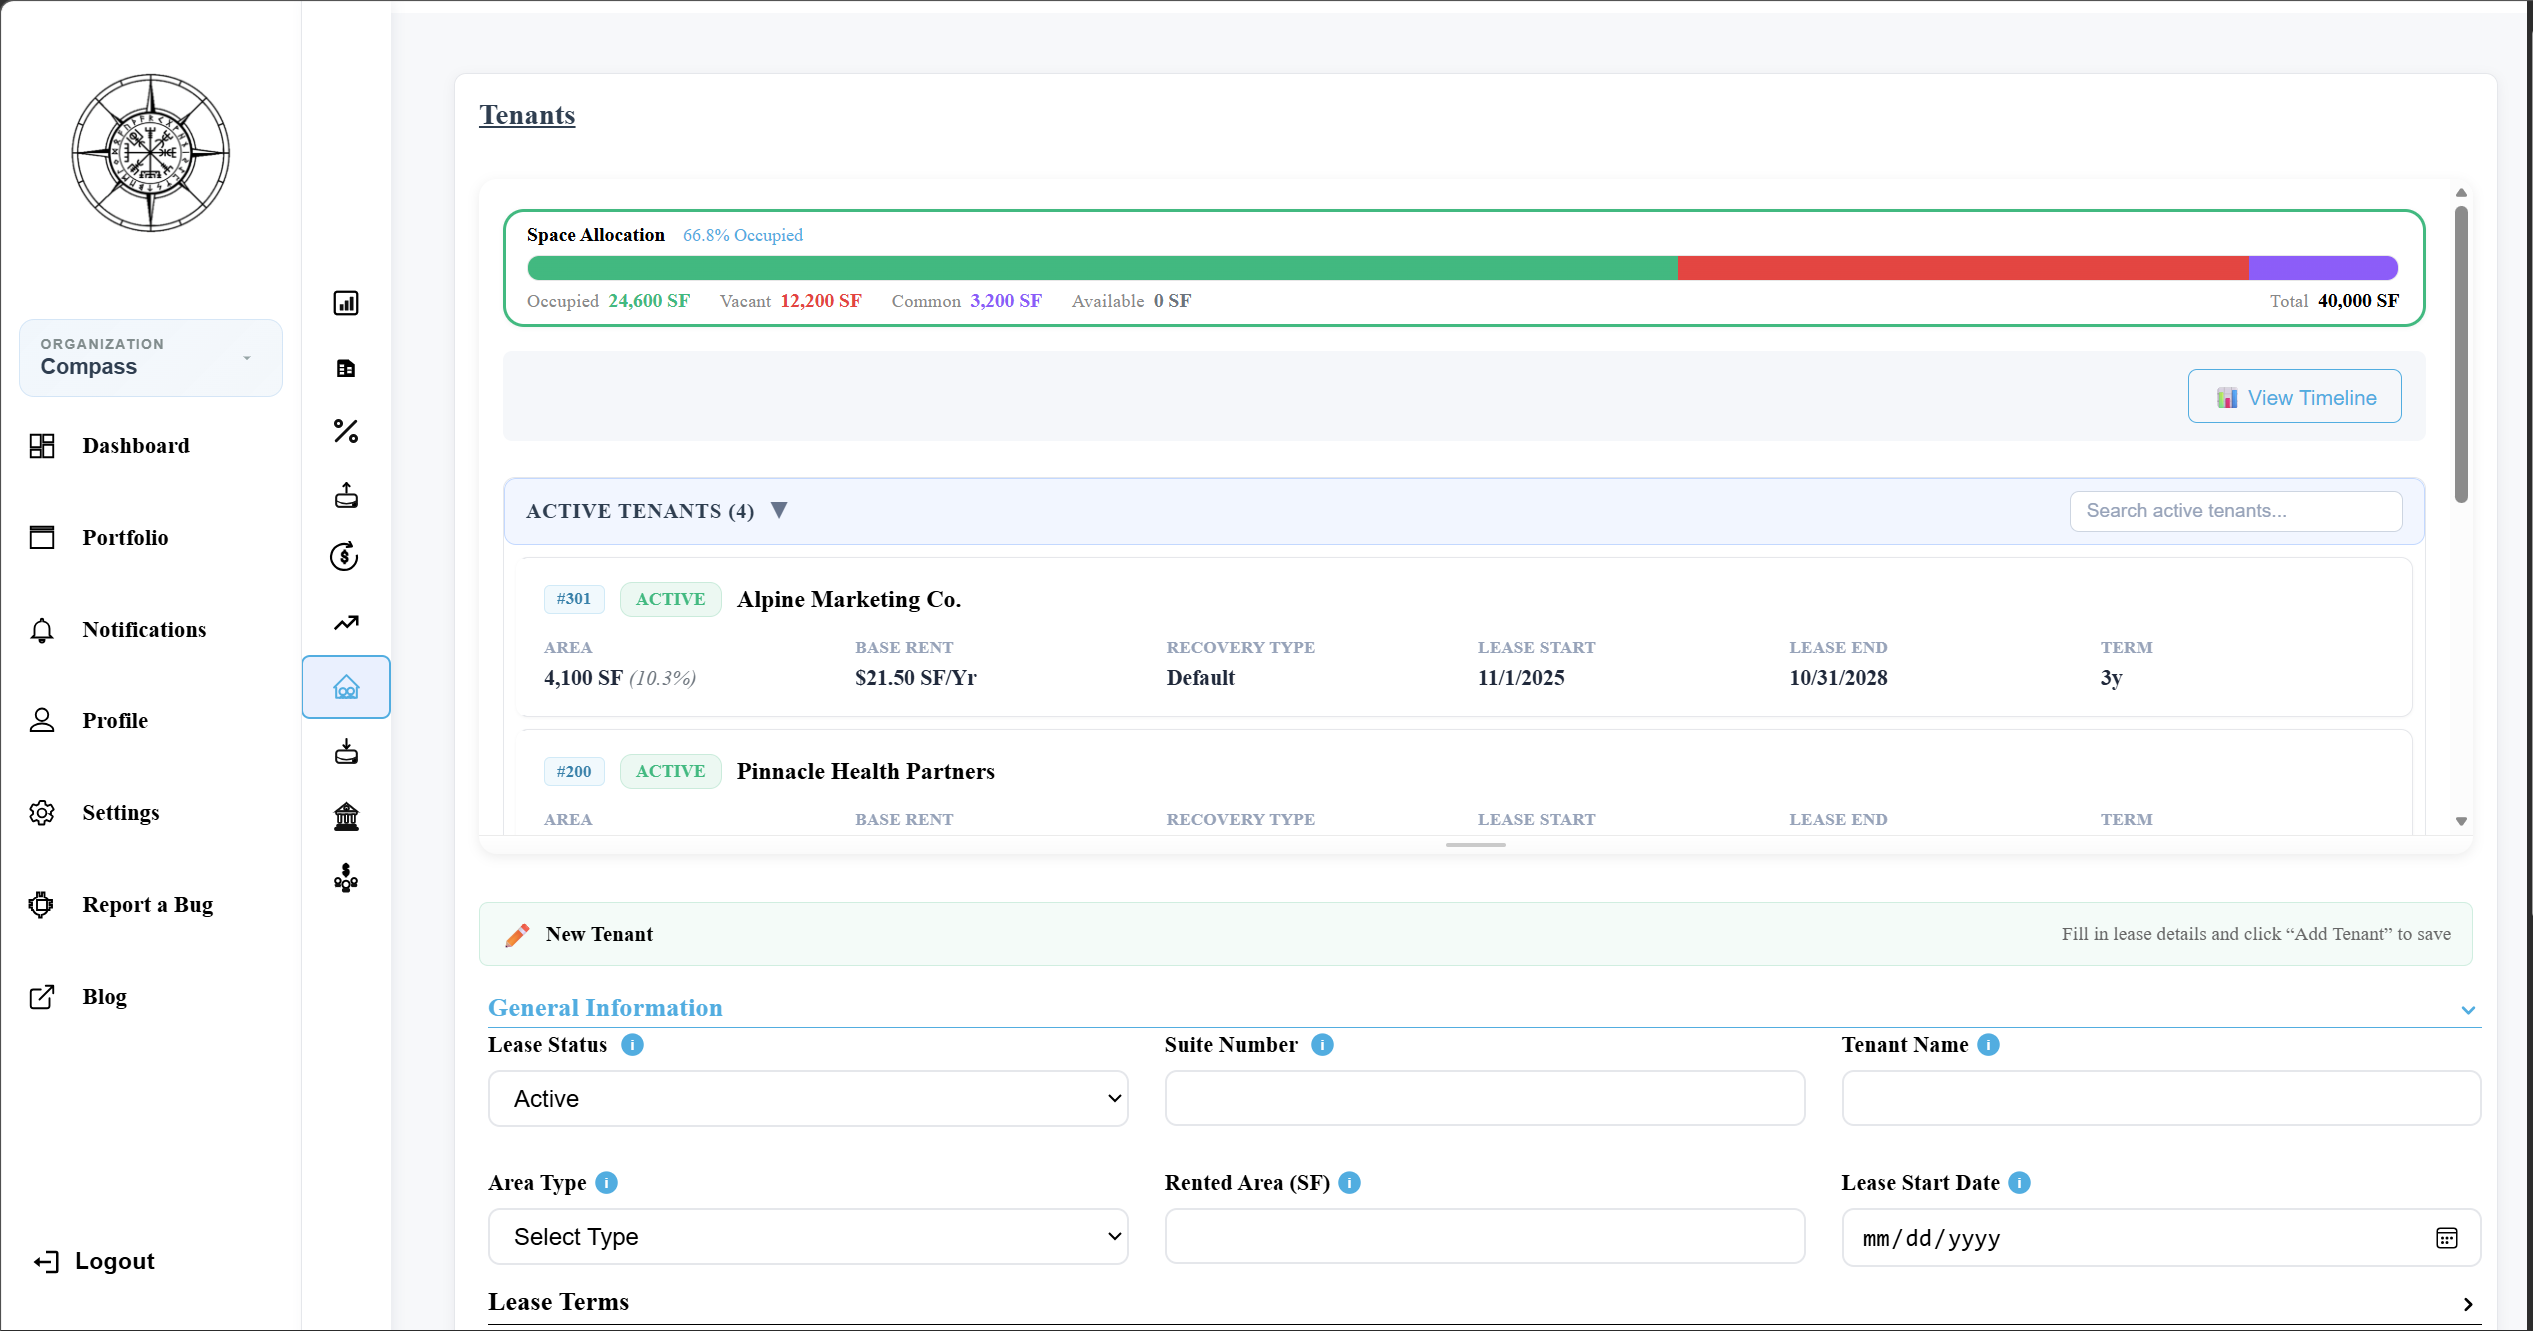
Tenant Lifecycle Form
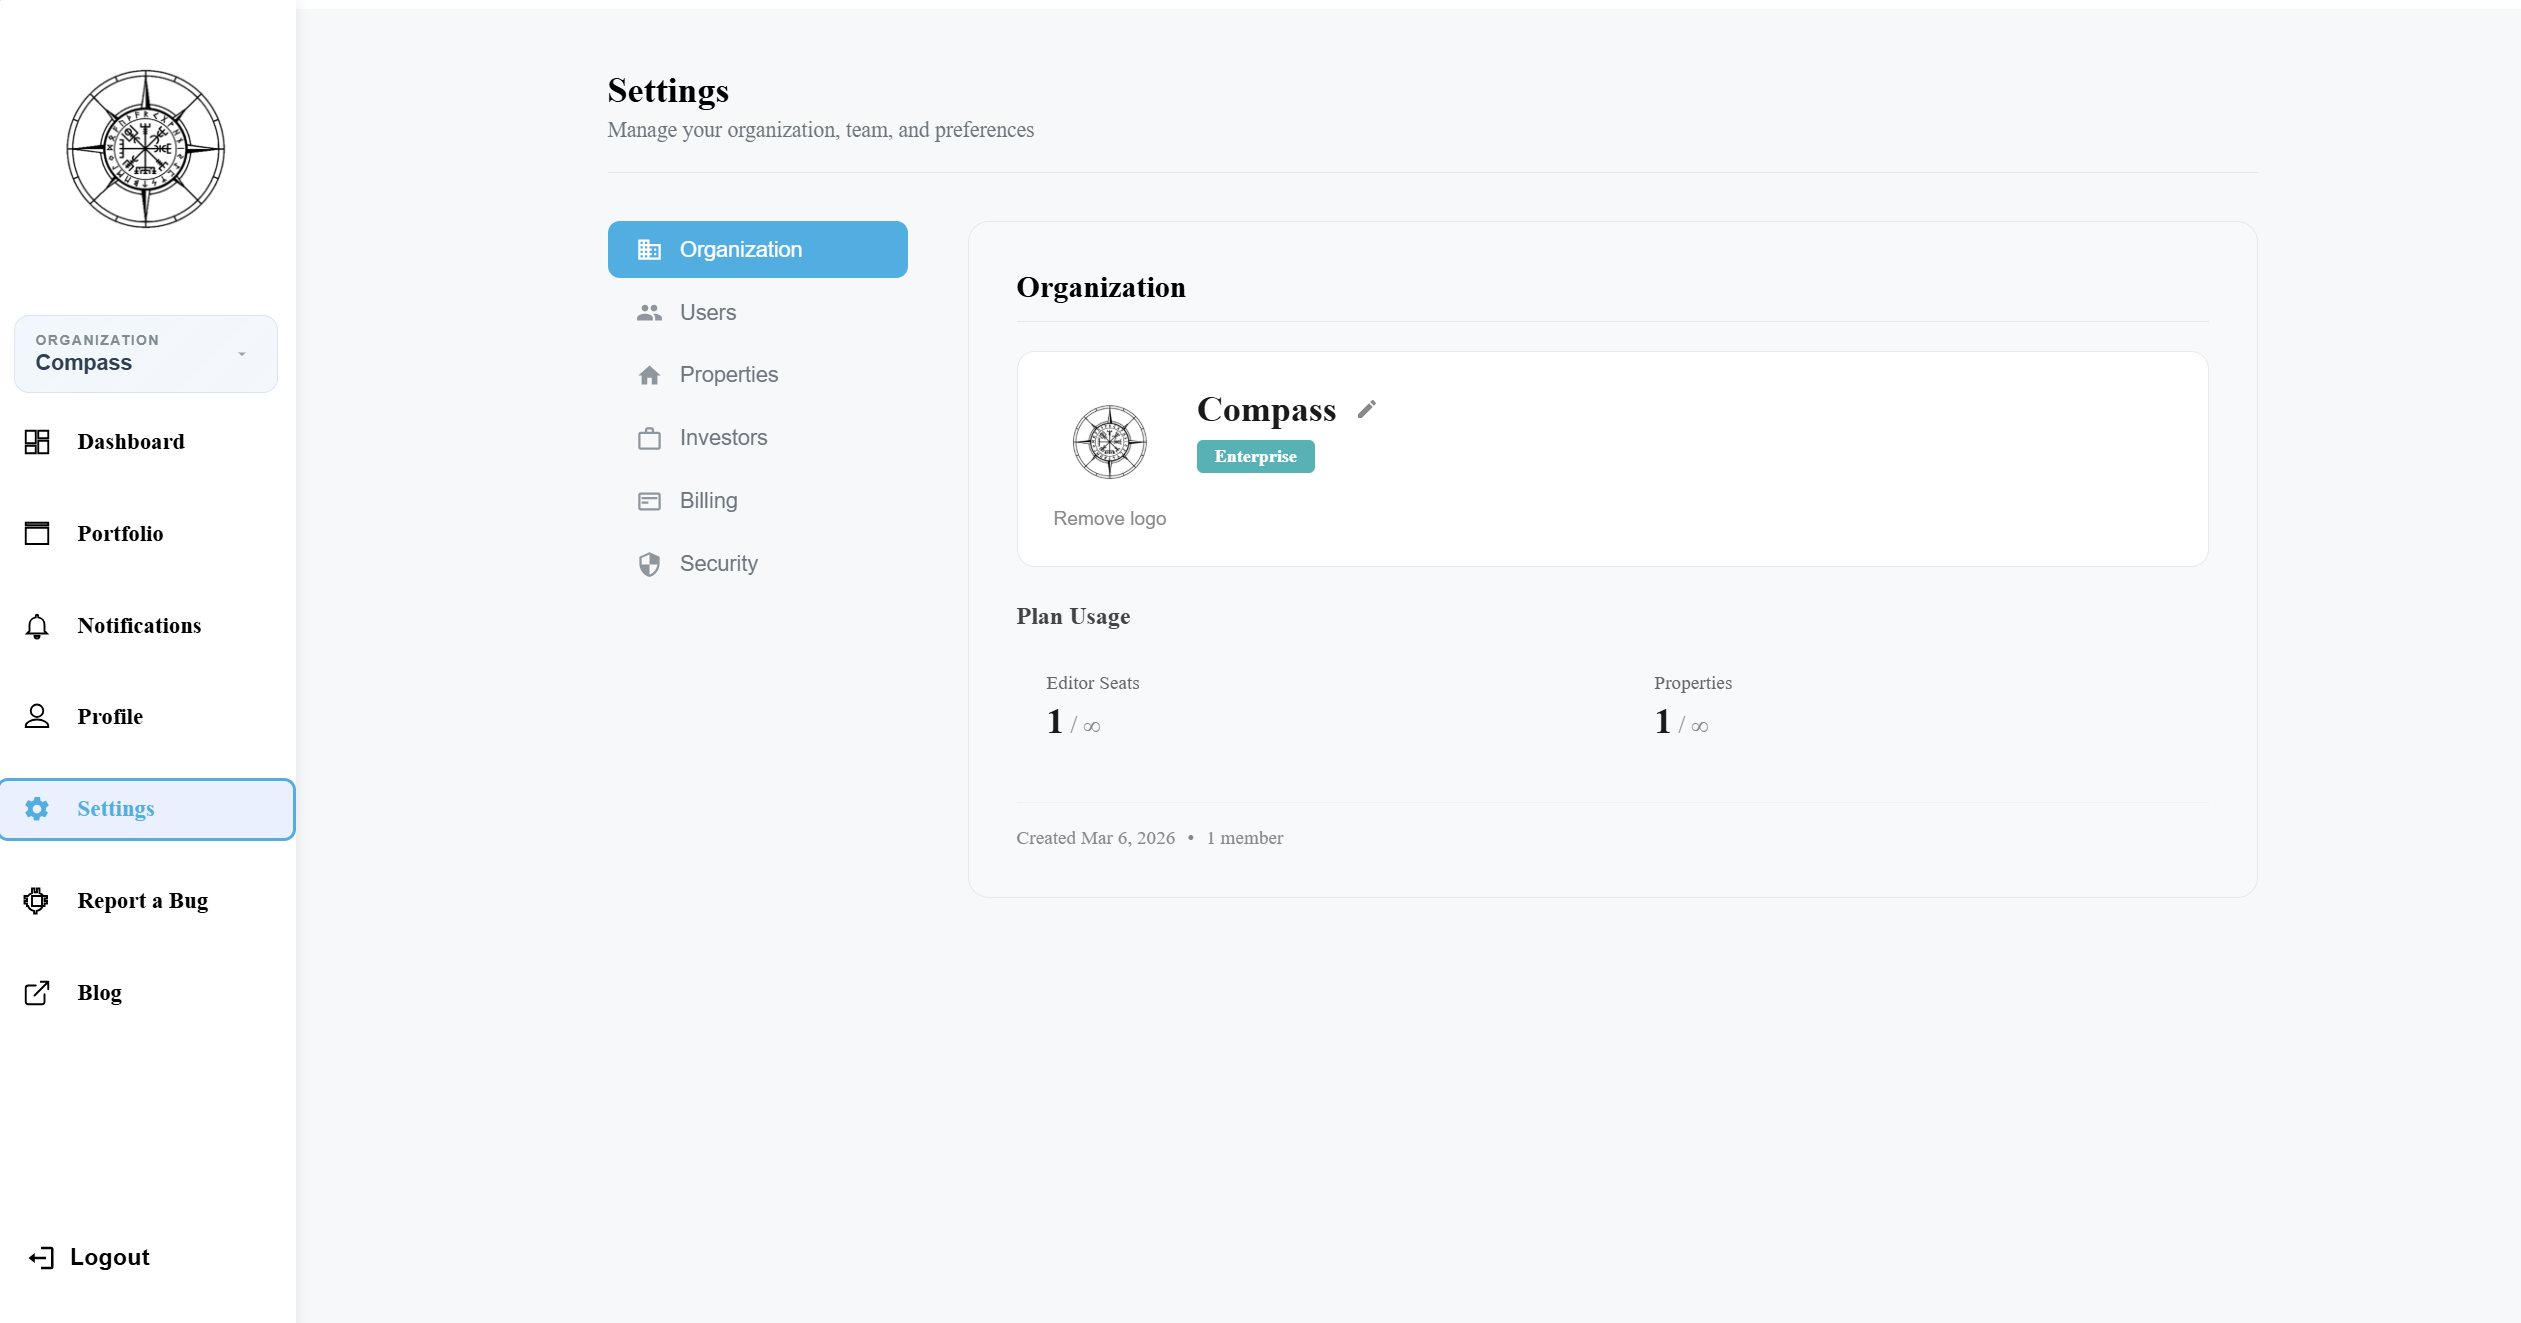
Organization Settings
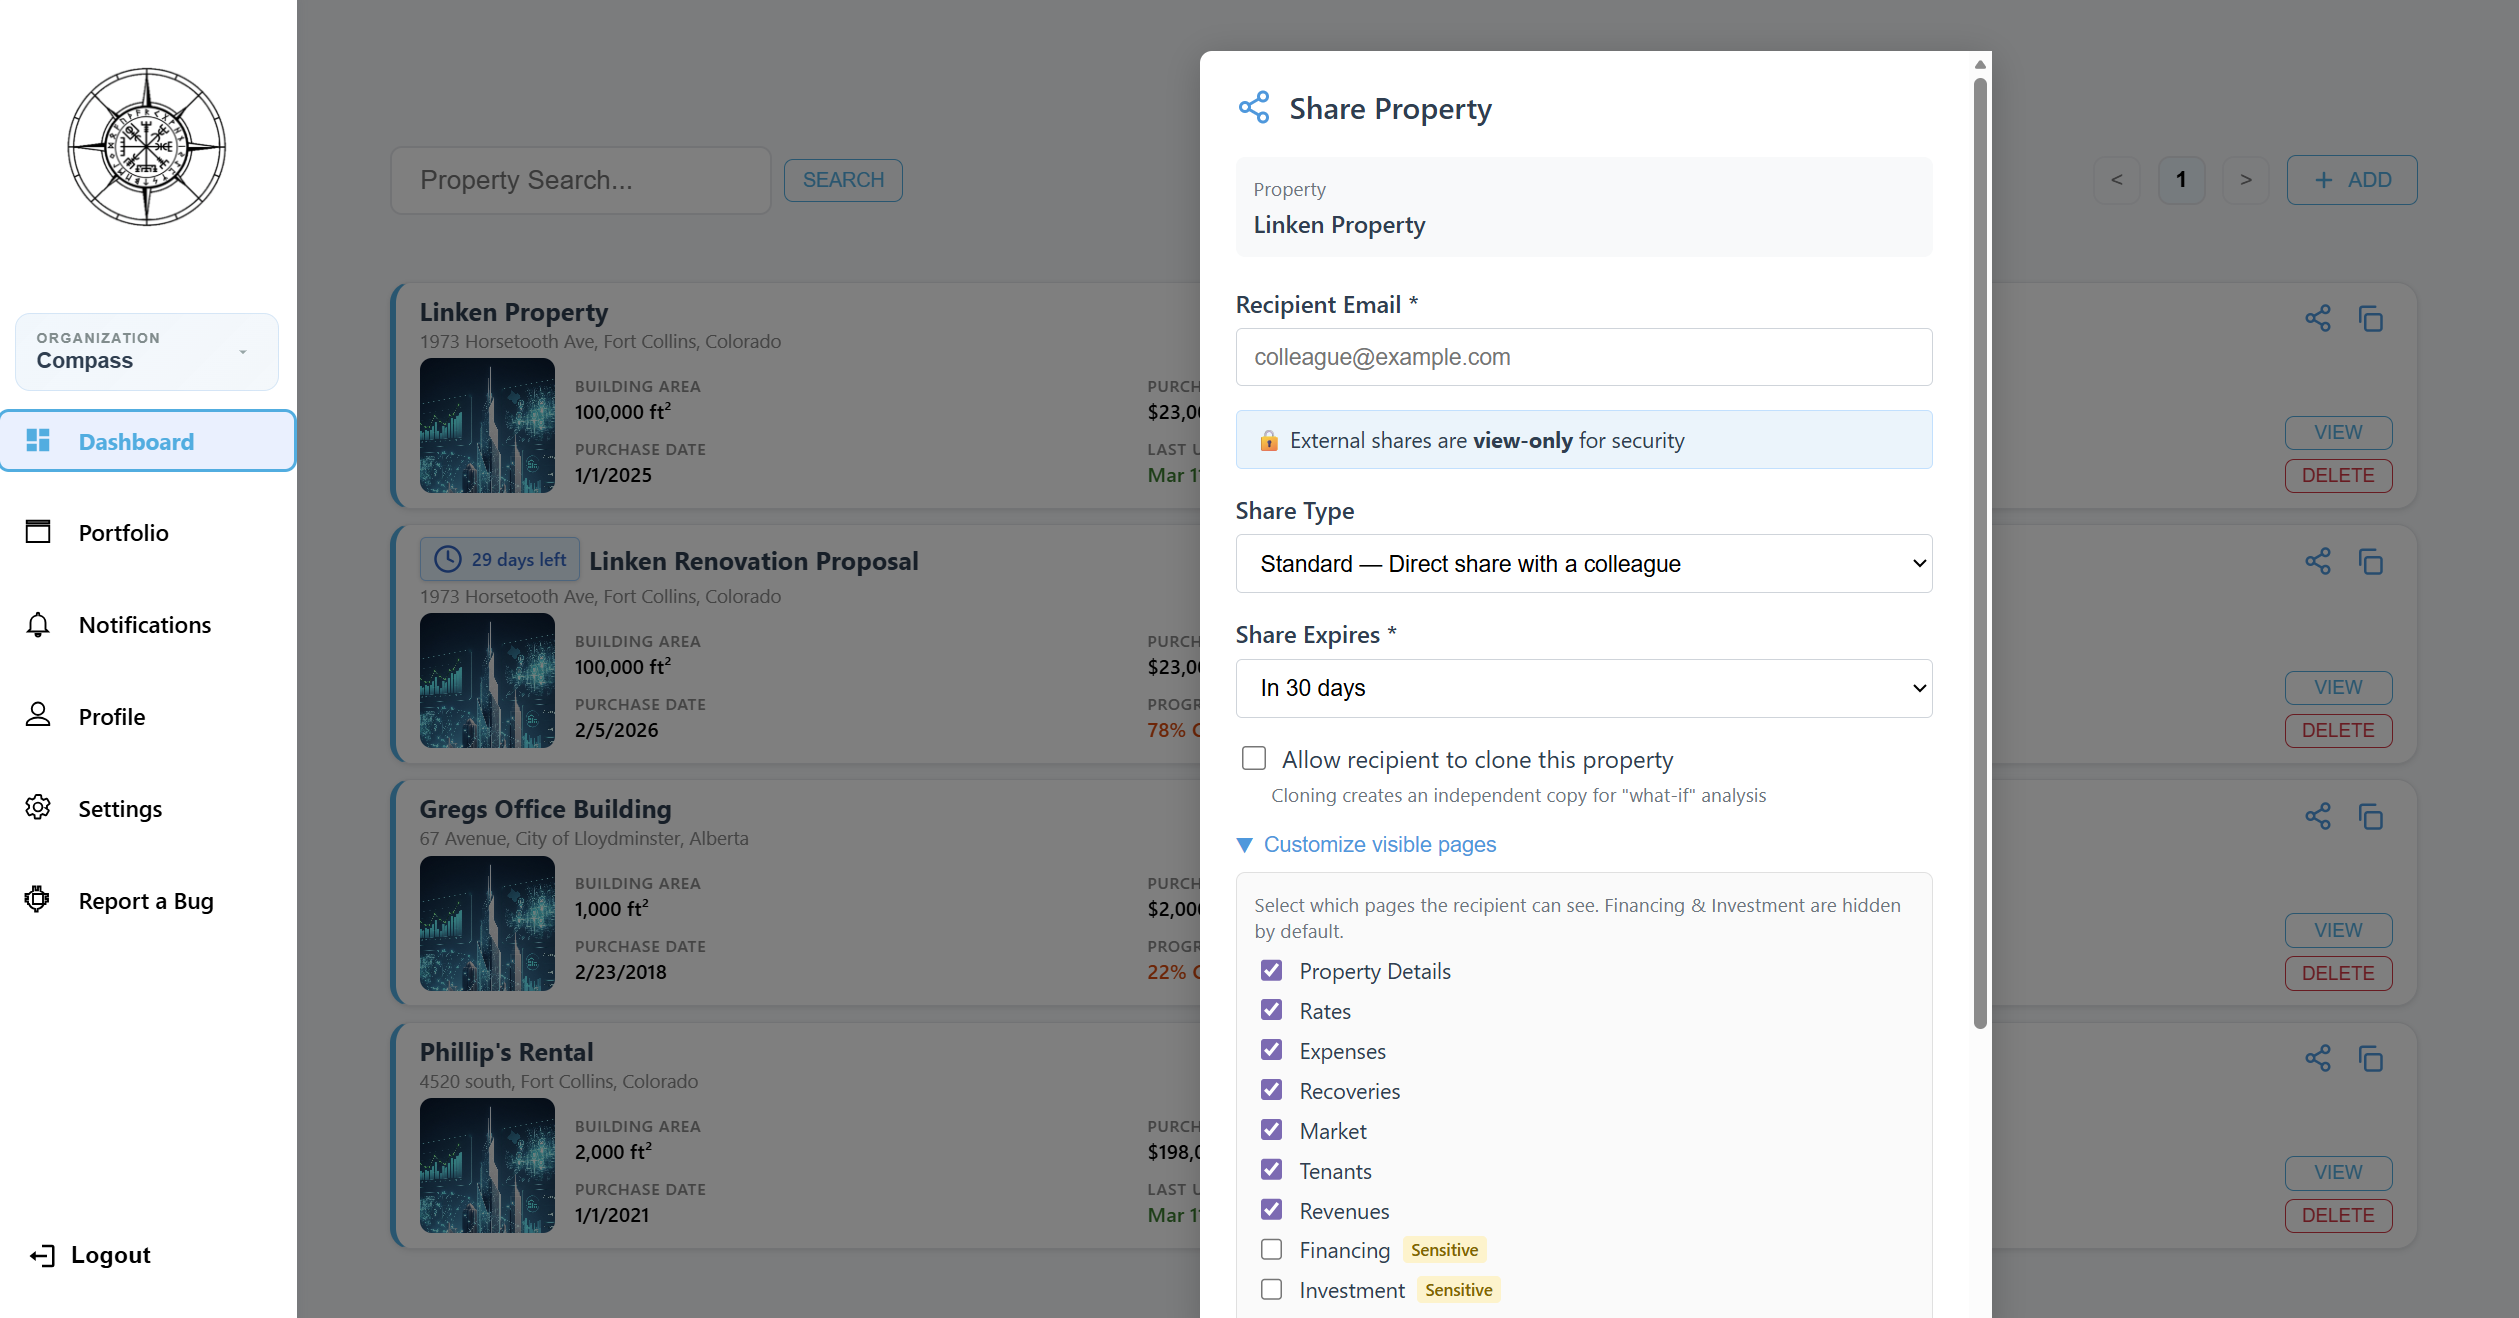
Share Property Dialog
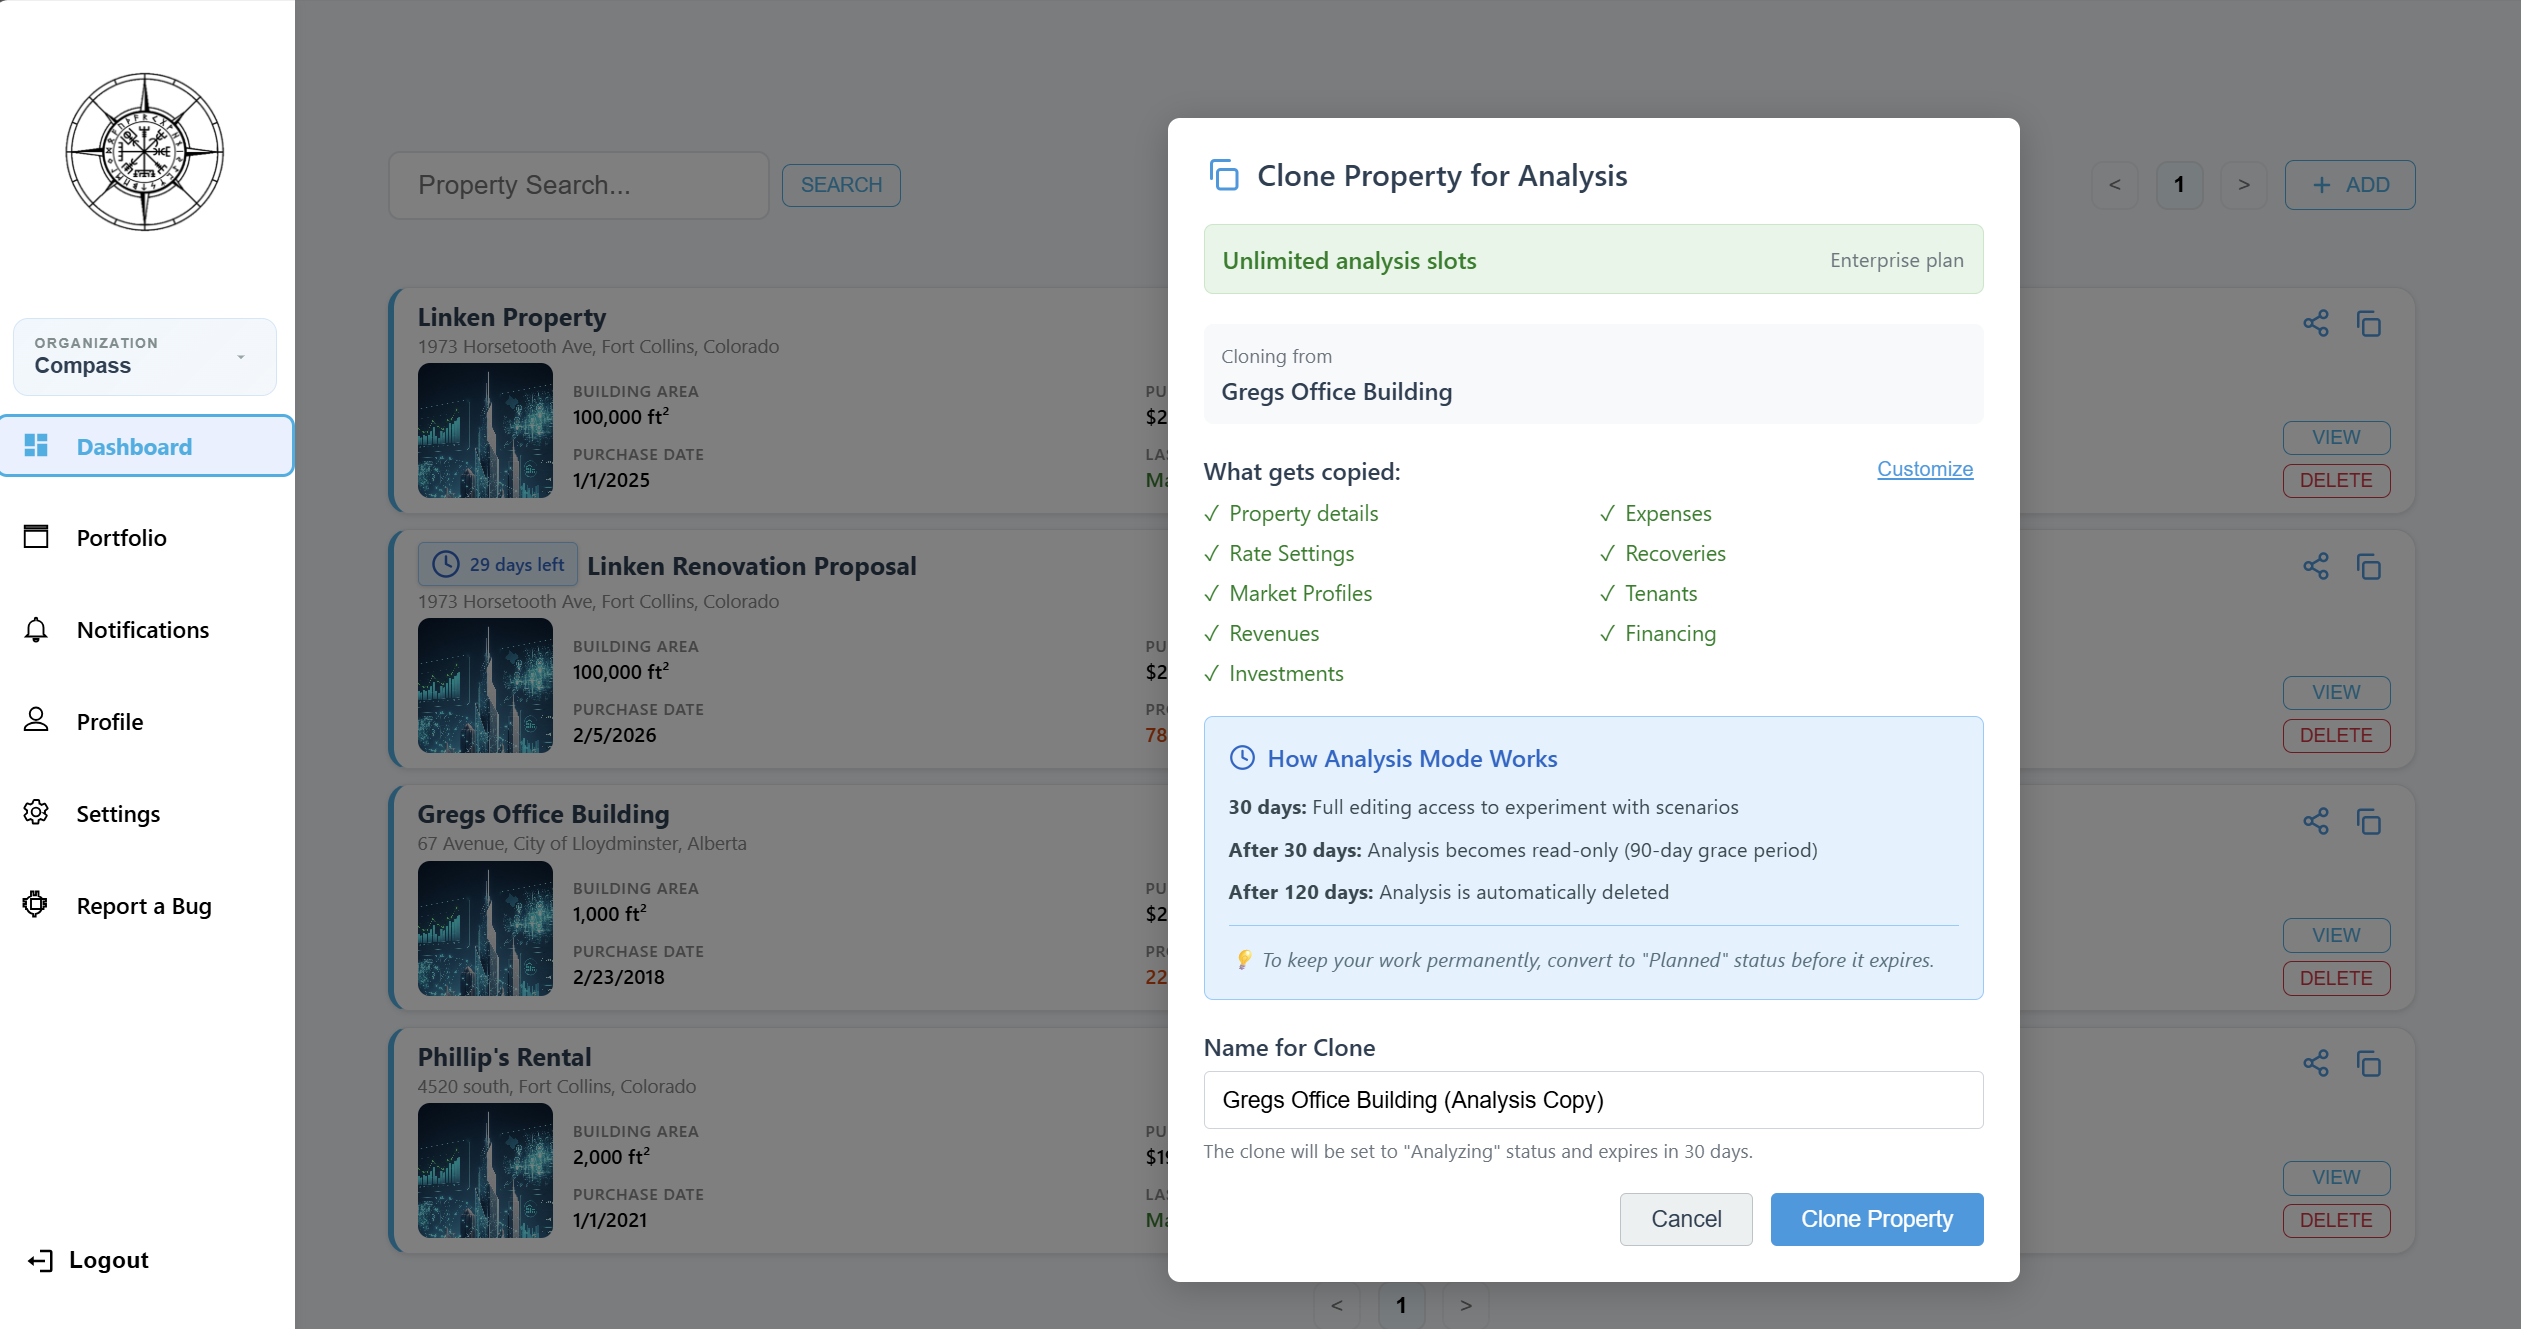
Clone Property Dialog
See It in Action
Start a free analysis and explore every feature — no credit card, no commitment.