Cap Rates:
Capitalization rates are the most widely used real estate investment metric. It is also one of the first definitions that most real estate investors learn. At the end of the day, how important is a cap rate? Should you be using cap rates to guide your investment decisions?
If you have been in real estate for any amount of time, you know that a cap rate is taking the net operating income (NOI) and dividing it by the purchase price.
For Example:
NOI $270,000/Purchase price $4,000,000 = 6.57% cap rate
Utilizing a cap rate is a useful tool to find a market benchmark. However, it should not be your sole source of valuation when making an investment. The problem with cap rates is that they do not take into consideration four major factors that drastically impact your bottom line.
Debt/Financing:
When utilizing a cap rate to value a property, that property valuation does not take into account debt. Debt is not considered in the calculation because financing terms vary depending on the owner. This makes it difficult to quantify the fair-market value of a property if accounted for in the valuation. However, just because cap rates do not consider financing does not mean you should overlook it.
When it comes to real estate, most investments are leveraged. This means that they have some form of debt on the property. This debt will change the return on investment. It is common in a high-interest market that debt will result in a negative leveraged investment. This means that if you purchased a property at a 6% cap rate and used borrowed funds, you will receive a lower return on investment than that 6% cap rate that you purchased it at. During a low-interest environment, there is a chance of having a positive leveraged investment. However, when there are low interest rates, it creates an increase in demand. The increase in demand pushes property prices up making an increased chance of going back to negative leverage.
If we do not consider closing costs, points, adjustable rate mortgages, other fees, and special terms associated with financing and you have a loan that has an interest rate higher than a 4.25% on a 6% cap rate investment, you will experience negative leverage. Let’s go over an example to make this concept a little more concrete.
Example:
We are planning to purchase a property that has a NOI of $225,000 at a 6% cap rate. We get a loan that has us put 25% down at a 4.6% interest rate and amortizes over 30 years. What type of cap rate are we really at and what type of cash-on-cash return will we really receive?
Before we can see the effect of negative leverage, we will have to find some unknowns. First, we need to find the purchase price. This is calculated by taking the NOI and dividing it by the cap rate.
$225,000/6% = $3,750,000
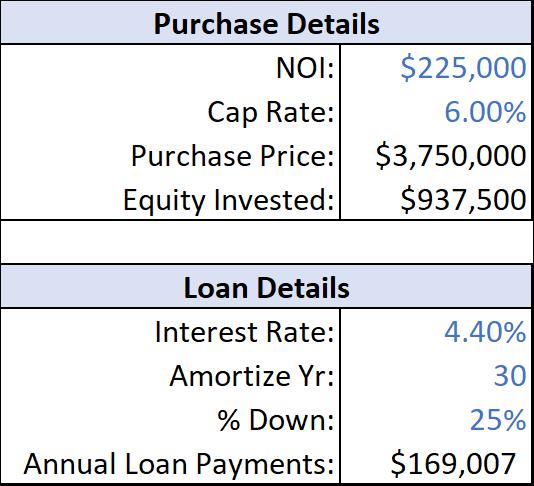
Out of that $3,750,000, we must invest 25% of our own equity which is $937,500.
$3,750,000 * 25% = 937,500
Lastly, we need to figure out what our annual loan payments will be. This is easiest to calculate through Excel and the formula is below.
$169,007 = PMT (Interest rate ((4.4%) / 12), Amortize years (30) * Number of payments per year (12), Loan amount ($2,812,500)) * Annual payments (12)
Now that we have all the information required to see the effect of negative leverage, let’s make sure you have a grasp of what a loan constant is so everything makes sense. A loan constant is the percent of the total loan amount that you pay to a bank through your annual payments (This is a combination of both interest and principal. To solve for the loan constant, you take the annual loan payments and divide it by the total loan amount.
$169,007 / $2,812,500 = 6.01%
This tells us that we are paying 6.01% of the loan amount to the bank every year in a combination of interest and principal. Now let’s calculate our cash-on-cash return to see if we are paying more to the bank than we are receiving.
($225,00-169,007) / $937,500 = 5.97%

So how do we interpret this information? In layman’s terms, we bought the property at a 6% cap rate expecting a 6% cash yield. When debt financing is considered, we will truly receive a 5.97% cash-on-cash return. In addition, we are paying out .04% more towards our debt each year than we are receiving. This is known as negative leverage.
Non-operating Expenses
The next key metric that cap rate overlooks is non-operating expense. Non-operating expenses are expenses that are associated with the property but vary depending on the owner. Some of these expenses include tenant improvements, leasing commissions, property improvements, marketing, attorney fees, and anything else that is not directly tied to the general operations of the property. Many of these expenses will occur during ownership of the property and should not be overlooked.
Instead of having a separate example, we will build off our previous example above. This is because nearly every investment will experience both simultaneously.
Example Continued:
During the analysis of the property, we find that there will be some rollover in the tenants. This means that we will have to pay leasing commissions to fill the vacancy. These commissions will total $7,850. In addition, due to the rollover, we estimate that we will have to pay a total of $12,150 in tenant improvements. This leaves a total of $20,000 of non-operating expenses for that first year of ownership. Let’s deduct that out of our net operating income and see where our cash-on-cash return lands.
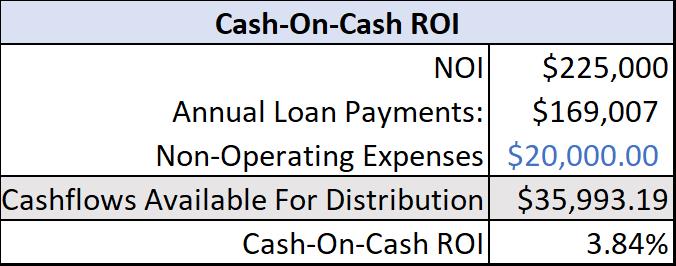
As you can see, after we included the loan payments and the non-operating expense, the cash-on-cash return has dropped by 2.16% from the original 6% leaving us with a cash-on-cash return of merely 3.84% for the first year of ownership.
Market Rent Growth
As an investor, it is imperative that you always project for the future and not the present. This is something that a cap rate does not achieve. A cap rate is everchanging with the market as time progresses and it does not project market rent growth. The effects the future may have on an investment is best explained through an example.
Example
Let’s say that there are two properties for sale in two different cities that we are looking to purchase. One is selling in Greeley at a 7.0% cap rate and another in Fort Collins at a 5.5% cap rate. Both are receiving the same net operating income of $75,000. At first glance, the higher cap rate sounds more appealing because for the first year you will receive higher returns. But let’s see what happens when we move forward in time to start of the fourth year.
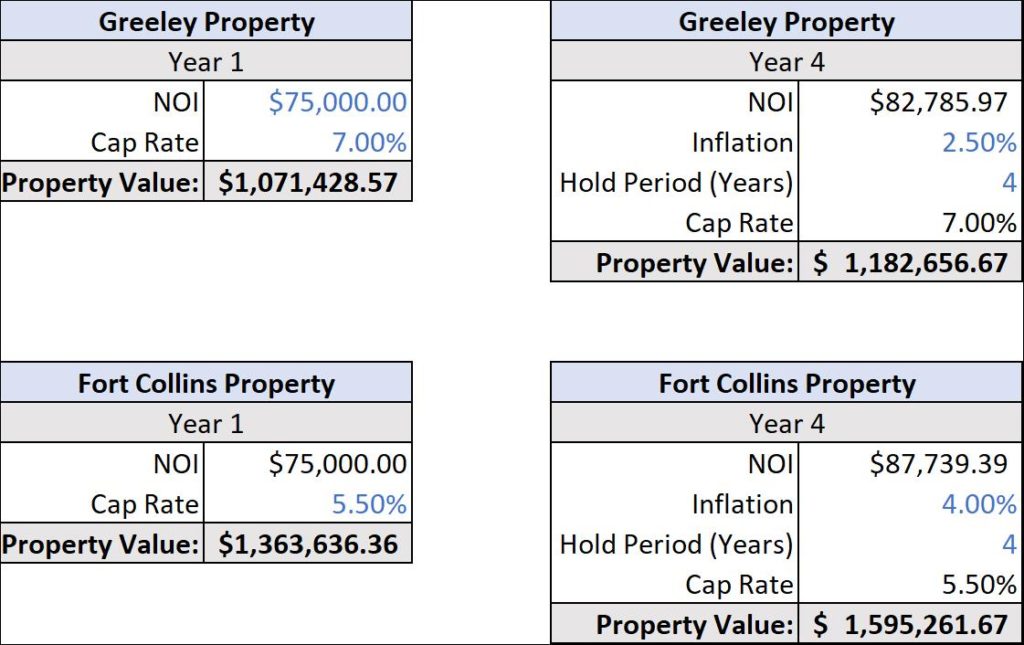
For simplicity, both properties are still valued at the same cap rate for their perspective region. Cap rates change through time and it’s better to project an increase in the cap rate through time to hedge against risk. Even though the cap rates remained constant, the NOI of each property has drastically changed. The property in Greeley ended up having a mild market rent growth of 2.5% per year leaving a projected NOI of $82,785.97. The property in Fort Collins experienced a large market rent growth of 4% per year giving the properties fourth year NOI of $87,739.39. Let’s see the effects that the market growth had on those properties return.
Even though the Greeley property was selling at a higher cap rate, we can see that the Fort Collins property will bring in the highest return.

As you can see, even though the property in Greeley looked more appealing due to a higher cap rate, it does not necessarily mean that you will receive higher returns in the future.
Value-Add
One of the most profitable methods of investing is through value-add properties. A value-add property is a property that has below-market lease terms, poor management, deferred maintenance, or anything that can be fixed through a change of ownership that will increase the properties cash flows or value. If you were to base your entire investment decision on a cap rate, you could easily miss out on a value-add property.
For example, do you think that purchasing a property at a 3% cap rate would be a crazy investment decision? In reality, is it really a poor decision once you learn more about the market? Let’s say the property is selling for $4,000,000. The property is 40% vacant. The market vacancy rate is expected to decline by 20% by the start of the next year. Finally, the in-place rent is 10% below market. Would you say that this is a good deal now? Let’s see what would happen in two years of owning the property.
For simplicity, we are going to assume the current in-place tenants all renew their leases at the market lease at the end of the first fiscal year.

As you can see, once we consider all the market details, the properties become way more appealing. The likelihood of finding a deal this amazing is exceedingly rare but not impossible. There is an infinite amount of deals out there where you can add value to a property and see amazing gains, but you will never find them if you only use a cap rate as your valuation metric.
What Metrics Should I Use?
Although cap rates are a great way to find the comparative market value of a property, it is just the tip of the iceberg on whether you will be achieving the returns you want or require. That is why we recommend only using the cap rate as a starting point. When you are analyzing a property, there are two main valuation metrics that you should be using that consider all the moving parts that a cap rate does not.
The first is levered and unlevered internal rate of return (IRR). IRR is the discount rate at which net present value of an investment is equal to zero. The net present value is the lump-sum value today of a string of future cashflows discounted back to today at a specified discount rate. Essentially the IRR metric is a time value of money metric, representing the true annual rate of earnings on an investment. The IRR metric will provide you with an annualized rate of return by considering your net operating income, capital expenses, and loan metrics. It is important to understand there are two types of IRR.
Unlike a cap rate, IRR is designed to consider all factors associated with an investment. It also considers time value of money. This metric allows you the ability to see the whole scope of the investment into a single percentage for each year. Remember to always plan and prepare for what a property can produce for you in the future and not what the property will produce for you today. To learn more about IRR go to our blog on “What Does A Good IRR Look Like?”
The next analysis metric that you should use is cash-on-cash return on investment. Cash-on-cash ROI is similar to cap rates. The difference is that it is based on how much money you put into the investment and not off the total purchase price. Unlike a cap rate, cash-on-cash ROI also considers non-operating expenses, capital expenses, debt services, and every cost associated to the property for the year that cap rate does not. To learn more about cash-on-cash ROI go to our blog on “Everything About Cash-On-Cash Return”
When you combine cash-on-cash ROI, both IRR metrics, account for all expenses associated with the property, and spend the time to find the right deal, it will be difficult to fail. It is also wise to analyze your property every fiscal year. This will help you prevent missing out on opportunities to improve your cash flow. All the valuations mentioned can be easily calculated in our investment software.


